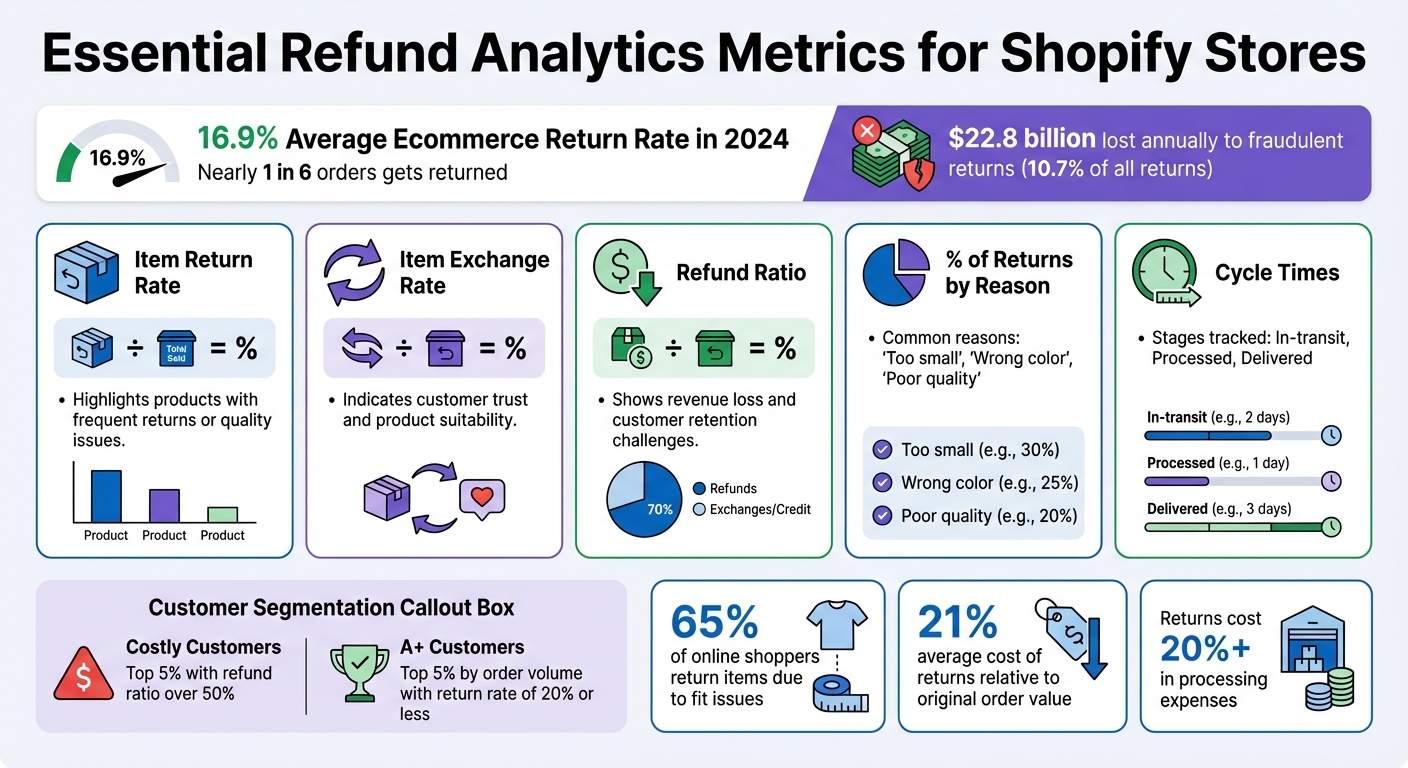
Refunds are a hidden drain on your Shopify store's profits, with the average ecommerce return rate reaching 16.9% in 2024. This means nearly 1 in 6 orders gets returned, leading to lost revenue, shipping costs, and processing fees. Worse, 10.7% of returns are flagged as fraudulent, contributing to a staggering $22.8 billion loss for US online retailers annually.
By leveraging analytics, you can pinpoint the root causes of refunds - like sizing issues or unclear product descriptions - and take actionable steps to reduce them. Key metrics such as item return rate, refund ratio, and percentage of returns by reason provide insights into problem areas. For instance:
- Item Return Rate: Identifies frequently returned products.
- Refund Ratio: Shows customer retention challenges.
- Cycle Times: Highlights delays that frustrate buyers.
Tactics like improving product pages, encouraging exchanges over refunds, and automating return processes can help retain revenue. Tools like ForthRoute automate these efforts, offering features like self-service portals and analytics dashboards for just $19/month. With the right data and strategies, you can turn refunds into opportunities to retain customers and protect your bottom line.
Simple Steps to Cut Ecommerce Returns (and Save Big)
How to Identify Refund Patterns Using Analytics
Key Metrics for Tracking and Reducing Ecommerce Refunds
If you want to reduce refunds, the first step is understanding why they happen. Raw sales numbers won’t tell you if returns are caused by sizing issues, poor quality, or misleading product images. To get to the root of the problem, you need to track metrics that reveal the reasons behind returns.
Key Metrics to Track
Start with the item return rate, which you calculate by dividing the number of returned items by the total units sold. This metric highlights which products are being returned most often. Another important metric is the item exchange rate - the number of exchanged items divided by total returned items. This shows whether customers are willing to give your products another shot or if they’re opting for refunds instead.
The refund ratio is another valuable metric. It measures the percentage of returns that result in refunds rather than exchanges or store credit. A high refund ratio suggests customers aren’t confident enough in your products to try again. Additionally, tracking the percentage of returns by reason - like “too small,” “wrong color,” or “poor quality” - can help you pinpoint specific issues with individual SKUs.
Don’t overlook cycle times, which measure how long items spend in "in-transit", "processed", and "delivered" stages. Delays in these stages can frustrate customers and lead to refund requests. Also, compare shipping costs to fees to see if return label expenses are cutting into your profits.
| Metric | What It Reveals |
|---|---|
| Item Return Rate | Highlights products with frequent returns or quality issues. |
| Item Exchange Rate | Indicates customer trust and product suitability. |
| Refund Ratio | Shows revenue loss and customer retention challenges. |
| % of Returns by Reason | Identifies specific reasons for dissatisfaction, like sizing or quality. |
| Cycle Times | Uncovers delays in processing or shipping that could frustrate customers. |
Once you’ve established these metrics, dive deeper into the data to uncover which products and behaviors are driving refunds.
Finding High-Risk Products and Patterns
With your metrics in place, you can start analyzing the data to identify problem areas. For example, look at product variants - such as size, color, or material - to find patterns. A product might have a manageable overall return rate, but if 70% of returns are for the "Medium" size, you’ve likely uncovered a sizing or manufacturing issue that needs attention.
Customer segmentation is another powerful tool. Use analytics to identify "Costly Customers" - the top 5% of shoppers with a refund ratio over 50%. These customers are eating into your revenue. On the other hand, "A+ Customers" are the top 5% by order volume with a return rate of 20% or less. Learning from these groups allows you to adjust your policies, such as blocking habitual refunders or offering perks to loyal buyers.
Keep an eye out for fraud and abuse patterns too. Fraudulent returns are a huge problem, costing the US online retail industry about $22.8 billion annually. Analytics can help you spot red flags like multiple orders from the same IP address or customers who frequently exploit “keep item” policies. Catching these behaviors early can safeguard your business, ensuring your return policies serve genuine customers while protecting your bottom line.
Using Analytics to Reduce Refunds
Take charge of refund data by refining product pages, encouraging exchanges or store credit, and automating return processes. These tactics align with earlier insights, transforming refund data into meaningful improvements.
Improving Product Pages and Sizing Information
If your analytics show a product is frequently returned for reasons like "too small" or "didn't match description", it’s time to revisit its product page. Gunner Kennels tackled this issue by introducing 3D models and augmented reality (AR), which reduced their returns by 5%. Macey Benton, their VP of Marketing, explained:
"With this technology, buyers can now use their device to place the crate right next to their dogs to confirm sizing, decreasing our return rate by 5%."
This update didn’t just cut returns - it boosted their cart conversion rate by 3% and increased order conversions by 40%. Considering that 65% of online shoppers return items due to fit issues, features like detailed size charts and AR tools that let customers visualize products in their own space can make a huge difference in reducing refunds.
Encouraging Exchanges and Store Credit
Exchanges and store credit are powerful tools for keeping revenue within your business instead of losing it to refunds. Start by tracking exchange rates to identify products that customers still value. Using AI-powered product recommendations during the return process can help convert refunds into exchanges.
For instance, if a customer returns a shirt because it’s "too small", suggest a larger size or a similar style. Sweeten the deal by offering a small bonus, like an extra $5, for those who choose store credit. This approach not only retains revenue but also builds on earlier refund data insights. You can also segment customers based on their behavior: offer instant credit to your top-tier buyers (the top 5% by order volume with a return rate under 20%) while applying stricter rules to high-return customers (those in the top 5% of return volume with a refund ratio over 50%).
Setting Up Automated Return Rules
Automation takes refund reduction to the next level by cutting processing costs - by at least 20% - and minimizing manual errors. Use analytics to create smart rules that streamline returns. For example, auto-approve returns under $50 to free up your support team, while flagging high-value returns for closer inspection.
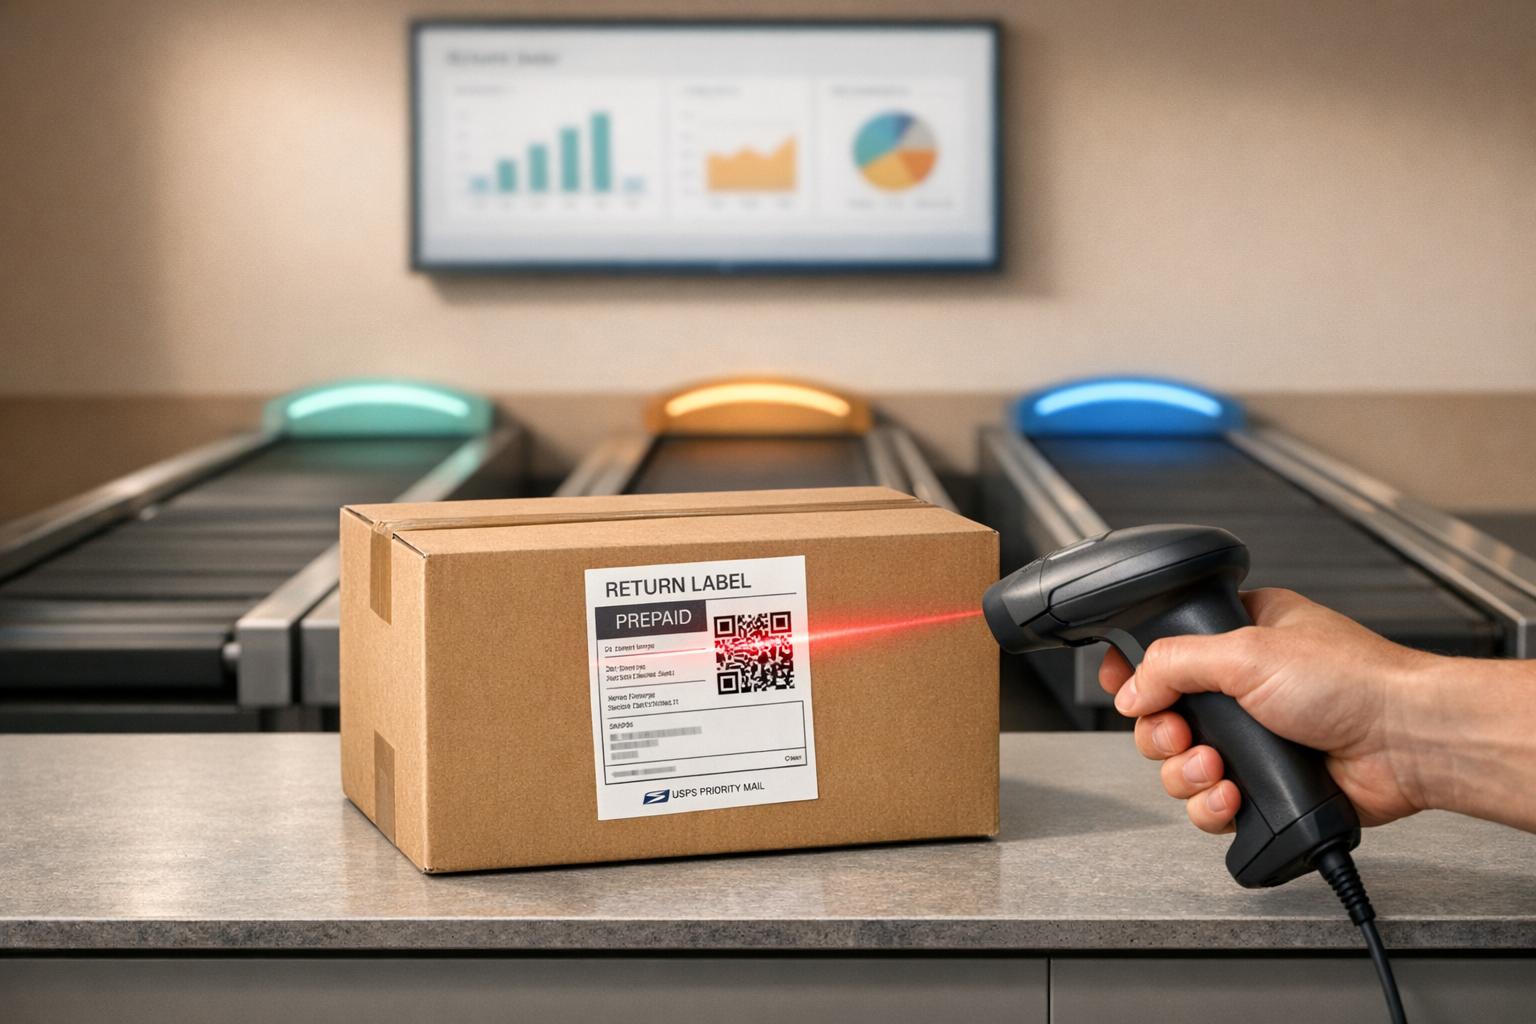
Travelpro® serves as a great example. In 2025, the luggage company implemented automated return rules that slashed their processing time from 20 minutes to just 90 seconds per return. Another effective strategy is setting up "Keep Item" rules for low-value products where shipping costs outweigh the product’s value. Analytics can help pinpoint these thresholds, allowing customers to keep the item while still receiving a refund or credit - saving on logistics and improving satisfaction.
To prevent fraud, use data to identify high-risk customers and enforce manual reviews or block repeat offenders. Additionally, set automated alerts for when a product’s return rate exceeds a certain threshold (e.g., 20%). This allows you to quickly update the product page or temporarily remove the item from your store.
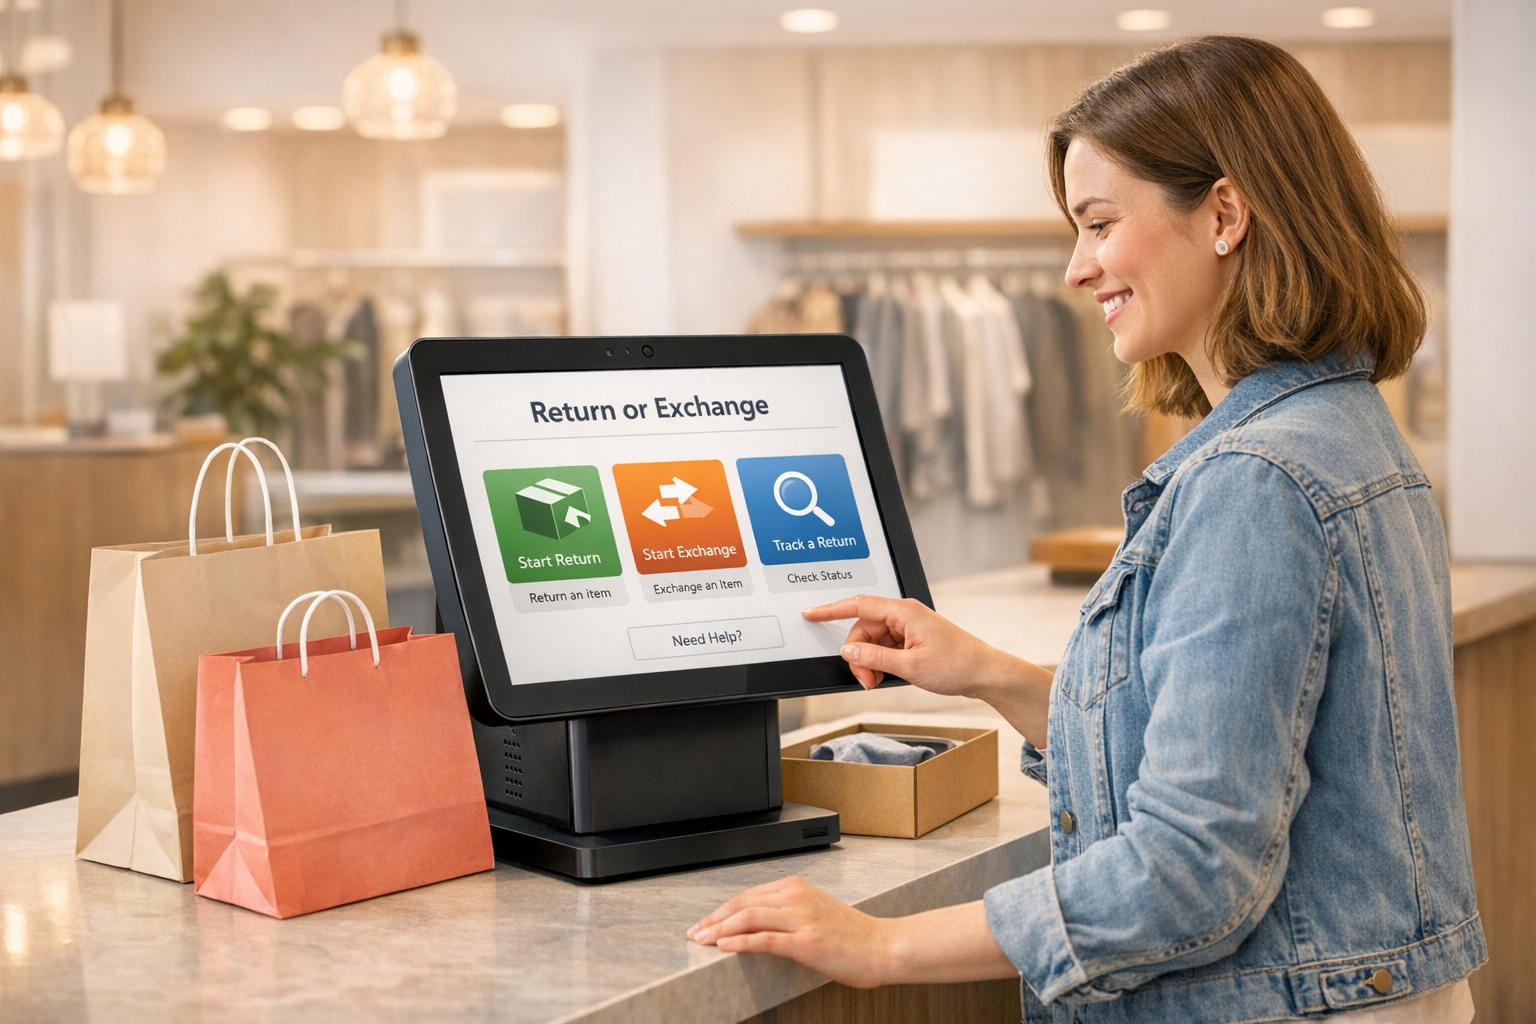
Platforms like ForthRoute demonstrate how automation can simplify returns. Their tools provide Shopify merchants with a smooth self-service return experience, helping turn potential losses into retained revenue.
sbb-itb-a3e286c
Tracking Your Refund Reduction Results
Keeping a close eye on analytics is key to understanding and improving your refund reduction efforts.
Monitoring Refund Rate and Revenue Changes
To measure how effective your refund reduction strategies are, start by tracking two important metrics: your refund rate and your exchange rate. The refund rate shows the percentage of returns that result in cash refunds, while the exchange rate indicates how many returns are converted into exchanges or store credit. If your exchange rate is higher than your refund rate, it’s a clear sign that you’re retaining more revenue within your business.
Another helpful metric is retained revenue, which you can calculate by adding up exchanges and store credit. Combine this with net sales (gross sales minus discounts and returns) to see the overall financial impact of your efforts. Comparing these numbers month over month can reveal trends and pinpoint areas that need immediate attention. This data also helps validate the effectiveness of strategies like automated return rules and exchange incentives discussed earlier.
Don’t forget to include all associated costs - like shipping, labor, restocking, and administrative expenses - when calculating your cost per refund. On average, returns cost U.S. online retailers 21% of the original order value. For example, in October 2023, Munchkin Inc., a baby product company, implemented a customized Shopify-Salesforce connector. This tool delivered 96% accuracy in shipping data and an 87% improvement in tracking refund orders, giving them better insight into the financial impact of returns.
Refining Your Strategy with Ongoing Data
Tracking results is just the beginning - refining your analytics over time is essential for sustained improvement. Modern analytics platforms often update data daily, giving you near real-time insights. To stay on top of things, set up automated reports to be emailed weekly or monthly, and configure threshold notifications for critical metrics. For instance, if a product’s return rate exceeds 20%, you can get an alert to immediately review and address the issue.
Regularly review return reasons by SKU to identify recurring problems, such as incorrect items being sent or sizing issues. For long-term planning, analyze data over a four-quarter period to uncover seasonal patterns and evaluate how your decisions are impacting returns over time. This deeper analysis can guide adjustments to product pages, exchange incentives, and automated rules.
If you’re looking for a tool to streamline this process, ForthRoute’s Professional Plan offers analytics dashboards for Shopify merchants at $19/month. These dashboards make it easier to track key metrics and refine your strategy based on real-time data. By consistently analyzing and acting on this data, you can fine-tune your approach and keep your refund reduction efforts on track.
Conclusion
Analytics is the backbone of any effective strategy to reduce refunds. By focusing on key metrics and leveraging automated tools, Shopify merchants can gain a clear picture of where revenue is slipping through the cracks. For instance, tracking return patterns, monitoring metrics like exchange and refund rates, and diving into product-level data can reveal critical problem areas. With 64% of eCommerce returns tied to unclear product details and online return rates reaching 30%, ignoring analytics comes at a steep cost.
Armed with these insights, you can take actionable steps to address the root causes of returns. Whether it’s enhancing product descriptions, fine-tuning sizing guides, or encouraging exchanges over refunds, understanding why customers return items is key. Automated return rules streamline the process, while exchange incentives help retain revenue within your business. As Jon Stern, VP of Client Experience at Retention Rocket, aptly explains:
"A return isn't a loss. It's a customer that was close to getting what they wanted".
ForthRoute’s suite of tools ties it all together. Their Professional Plan, priced at $19/month, offers a branded self-service portal, automated approval rules, and analytics dashboards to help you identify which products are frequently returned and why. By prioritizing exchanges and store credit, ForthRoute shifts refunds into retained revenue. Features like instant store credit and automation reduce manual effort while keeping more money in your business. Use these analytics-driven strategies to refine your return processes and reclaim revenue that might otherwise be lost.
FAQs
How can I use analytics to reduce refunds in my Shopify store?
Analytics gives you the power to uncover the main reasons behind refunds, helping you tackle the issues at their core and reduce how often they happen. By diving into return trends - like identifying the most frequently returned products, common refund reasons, or specific order values - you can make precise adjustments. These might include improving size charts, fine-tuning product descriptions, or addressing fulfillment problems. Such targeted actions can go a long way in preventing future returns.
Beyond that, analytics can also help steer customers toward exchanges or store credit instead of outright refunds. For instance, by spotting patterns such as high-risk orders or repeat returners, you can implement smart rules to automate approvals or suggest alternative options. Tools like ForthRoute’s self-service portal make it easy to integrate these insights into your operations. This allows for real-time tracking of return rates and reasons while automating exchange suggestions, helping you keep revenue intact and boost customer satisfaction.
What metrics should I track to reduce refunds and improve retention?
Tracking the right metrics is crucial when it comes to understanding and cutting down on refunds. Start with your refund rate - this tells you the percentage of orders that end up being refunded. Then, take a closer look at product-specific return rates, which show returns for each SKU or variant, and examine the top return reasons to pinpoint problem areas, like sizing issues or other recurring concerns.
Operational data is just as important. Metrics such as time-to-return (the number of days between purchase and a return request), processing time (how long it takes to approve and complete a return), and cost per refund (factoring in shipping, labor, and restocking fees) can reveal inefficiencies in your process. Additionally, keep an eye on the exchange-to-refund ratio and average refund amount - a low exchange ratio might suggest missed chances to retain customers and revenue.
By analyzing these numbers, you can spot trends - such as frequent returns tied to fit issues or bottlenecks in processing - and take action to address them. Tools like ForthRoute can provide real-time analytics for these metrics, giving you the insights you need to protect your bottom line while improving the customer experience.
How does automation simplify returns and help retain revenue?
Automation is reshaping the returns process by streamlining what used to be tedious, manual tasks. With a self-service system, customers can now initiate returns in just a few clicks - simply by entering their order number and email. In moments, they receive prepaid shipping labels, and if their return meets pre-set criteria, it’s automatically approved. What used to take around 20 minutes per return now takes just 90 seconds. That’s a huge time saver, cutting labor costs while boosting efficiency.
But it’s not just about speed. Automation also helps businesses hold onto revenue by steering customers toward exchanges or store credit instead of refunds. AI-driven recommendations, like suggesting a different size or an alternative product, nudge customers to swap items rather than return them outright. This strategy can save up to 65% of an item’s value that would otherwise be lost. On top of that, analytics tools dig into return trends and reasons, giving businesses actionable insights. These insights help reduce future refunds and pave the way for better profitability in the long run.