Returns are costing ecommerce businesses billions. In 2024, $890 billion worth of products were returned, with online return rates averaging 16.9% - and even higher for apparel brands (20%-40%). These returns cut into profits through shipping, labor, and restocking costs, while also damaging customer loyalty.
Here’s the good news: you can reduce return rates by addressing key issues like poor product descriptions, inaccurate sizing, and lenient policies. Start by tracking metrics like return rates by product, reasons for returns, and cost per return. Use this data to improve product pages, add detailed sizing charts, and include high-quality photos and videos. Automating return workflows can also save time and cut costs, while offering exchanges or store credit instead of refunds helps retain revenue.
Key takeaways:
- 70% of apparel returns happen due to fit or style issues.
- Tracking metrics like preventable return rates can highlight problem areas.
- Adding tools like 3D models or AR can reduce returns by up to 5%.
- Automated systems like ForthRoute streamline returns, saving time and improving customer satisfaction.
Fixing return rates isn’t just about cutting losses - it’s about creating a smoother shopping experience that keeps customers coming back.
How to Reduce Returns in Ecommerce Without Hurting Sales
Using Data to Find the Root Cause
You can't fix what you don't measure. Before tweaking product pages or revising return policies, it’s crucial to pinpoint which products have high return rates and understand why customers are sending them back. Metrics turn guesswork into actionable steps.
Which Return Metrics to Track
Start by tracking unit return rates and price-based returns. These metrics help you identify products that are returned frequently or those with the highest financial impact. Another key metric is the return-to-order differential, which compares a product's share of total orders to its share of total returns. For example, if a product accounts for 5% of orders but 12% of returns, that’s a red flag.
The preventable return rate focuses on returns caused by factors within your control, like sizing issues, misleading descriptions, or inadequate packaging. This metric highlights areas where internal changes can make the biggest difference. Additionally, track the cost per return, which includes expenses like inbound shipping, inspection labor, and lost resale value. Monitoring resale value recovery - how much value you retain when restocking items - can also provide key insights. To stay proactive, set alert thresholds. For instance, a 20% week-over-week increase in returns or preventable returns exceeding 10% should trigger immediate action.
Standardize your return categories and gather customer feedback. Automated analytics tools simplify this process, helping you spot trends without the hassle of manual data entry.
Once these metrics are in place, use them to analyze patterns and uncover recurring issues.
Finding Patterns in Your Return Data
With detailed metrics, you can identify patterns and focus on specific problems. Products with return rates exceeding 15% to 20% should be flagged for immediate review of their product pages. Items in extreme sizes, like XS or XL, often show higher return rates. Segment your data by product type, vendor, and customer type. For example, new customers might return items more often as they adjust to your sizing standards.
A great example of data-driven action comes from Gunner Kennels, which reduced return rates by 5% and boosted conversions by 40% by adding 3D models and augmented reality to help customers visualize products. This demonstrates the impact of turning insights into action.
"If you see a spike in 'color not as expected' or 'fit is too small,' that is usually a product page issue, not a warehouse problem."
– Agatha Aviso, Senior Staff Writer, TechnologyAdvice
Match return reasons with actionable solutions. If "too big" or "too small" is a common complaint, update size charts or include model measurements. If "not as depicted" appears frequently, review and improve your product images. For issues like damaged or defective items, consider implementing stricter supplier quality checks or improving packaging. Tools like word clouds can help you quickly scan customer comments for recurring terms like "stitching" or "fragile". These insights not only highlight problem areas but also provide a roadmap for refining product pages and return policies.
How to Prevent Returns with Better Product Pages
Improved product pages can make a big difference in cutting down returns. Did you know that 22% of returns happen because the product didn’t match its online description? And for fashion items, 49% of returns occur because products look different in person. Many of these returns are completely avoidable when product descriptions and visuals set clear, accurate expectations. By addressing discrepancies highlighted in your return data, you can significantly reduce the number of items coming back.
Writing Accurate Product Descriptions
Details matter. Include exact dimensions (in inches), weight, materials, and care instructions in your descriptions. Avoid vague terms like “lightweight” or “compact” and stick to specific measurements. For apparel, sizing and fit issues are responsible for 42% of online returns, so providing detailed, brand-specific size charts is a must. Instead of relying solely on labels like S/M/L, include precise measurements like chest width or inseam length.
Consider adding a clear "what’s included" and "what’s not included" section. This ensures customers know whether accessories like belts or charging cables are part of the purchase. Also, mention compatibility requirements and any technical specs. For example, Desert Steel does a great job by italicizing product dimensions in descriptions and showcasing their products in garden settings to give a sense of scale.
Address common return reasons head-on. If reviews frequently mention that an item "runs small", highlight this detail in a noticeable way, like using a different font color. You can also let customers filter reviews by categories like "size" or "fit", so they can see feedback from shoppers with similar preferences or body types.
Using Photos and Videos to Show Products Clearly
High-quality visuals are non-negotiable. 90% of customers say product photo quality influences their buying decision. Provide multiple angles and close-up shots to showcase textures, details, and quality. For apparel, use models of various sizes and include their height, measurements, and the size they’re wearing. This helps customers make informed decisions.
Scale can also be tricky to judge online, so show products next to everyday items for context. A great example of this is Gunner Kennels, which introduced 3D models and AR technology in February 2025. Their Shopify store lets customers place virtual dog crates next to their pets to check sizing. This initiative, led by VP of Marketing Macey Benton, reduced return rates by 5% and boosted order conversions by 40%.
Videos take it a step further by demonstrating functionality that photos can’t. 73% of consumers are more likely to buy after watching a product video. Use videos to show assembly steps, how zippers work, or how fabric moves naturally. Make sure to use natural lighting for authenticity. User-generated content is another great way to provide realistic views that polished studio photos might miss.
The key is to ensure your visuals match customer expectations, minimizing misunderstandings that lead to returns.
Testing Different Product Listings
If certain products have return rates above 15%–20%, it’s time for a closer look. Conduct A/B testing on these high-return items to figure out what works best. Try out different size chart formats, photo angles, or video placements to see how they impact customer satisfaction.
Tailor your updates to address specific return issues. For example, if customers often say "color not as expected", include fabric close-ups taken in natural lighting. If "missing features" is a common complaint, add a detailed checklist of what’s included. Track return rates after making these changes and apply successful strategies to similar products.
Automating Returns with ForthRoute
Handling returns manually can be a major drain on resources. Automating this process, however, can cut processing time by 90% and reduce support tickets by 80%. ForthRoute streamlines the entire return workflow, using automated rules to instantly approve or reject requests based on your criteria. This efficient system not only saves time but also enhances customer satisfaction, tying back to the improved experiences mentioned earlier.
The cost of processing a single return can range from 20% to 65% of the item's original value. By automating routine tasks, you can significantly lower those costs. For example, when a customer initiates a return, ForthRoute’s rules engine evaluates the request in seconds, avoiding the delays that come with manual reviews.
Setting Up Automatic Return Approvals
ForthRoute enables you to manage returns with minimal effort through automated rules. For instance, you can set up auto-approvals for lower-value items (e.g., under $50) and flag higher-value returns for manual review. Similarly, final sale items can be automatically declined, saving your team from repeatedly explaining return policies.
A great example of this in action comes from Travelpro, a luggage manufacturer. In April 2025, they transitioned from manual processing to automated workflows. Previously, their team spent 20 minutes on each return. After implementing ForthRoute’s rules and carrier integration, processing time dropped to just 90 seconds per return.
"The return process is completely customer-centric. They fill out the request, generate the label, and get a refund."
– Mark Costigliola, eCommerce Operations Manager at Travelpro
You can also customize your rules to prioritize loyal customers. For instance, automatically approving returns for shoppers with a high lifetime value or a low history of returns can enhance their experience.
Building a Self-Service Returns Portal
A branded self-service portal allows customers to manage returns on their own, without waiting for business hours or dealing with lengthy email exchanges. Customers simply enter their order number and ZIP code, select the items they’re returning, provide a reason, and choose their preferred resolution - whether it’s a refund, exchange, or store credit [23,24]. The process is quick and straightforward, with instant confirmation and a prepaid shipping label provided upon approval.
ForthRoute’s onboarding process is twice as fast as traditional setups, saving your team five times the manual effort. Integration with your Shopify store and shipping carriers is simple, and you can fully customize the portal to match your brand’s tone and style. You even control the messaging on every screen and in every customer email.
This level of transparency reduces inquiries about refund statuses. In fact, 92% of consumers say they’d buy again from a brand with an easy returns process, while 85% would stop shopping with a brand after a bad return experience.
"It is the most personal support system we've ever used. Kinda like texting a friend, we shoot them a concern, and immediately they're taking care of us."
– Rachel Piccone, Head of CX
Offering QR Code Returns Without Printing
Not everyone has access to a printer, and requiring printed labels can add unnecessary friction. ForthRoute solves this by offering printerless returns through QR codes. Customers simply show the QR code on their phone at a FedEx, UPS, or USPS location, where the carrier prints the label on-site [27,30]. This ease of use is a big reason why 96% of customers say they’d continue shopping with a brand that makes returns simple.
These dynamic QR codes can also be updated in real time as your return policies change, eliminating the costs associated with unused pre-printed labels. Once a return is approved, customers receive the QR code instantly via email or through the self-service portal, ensuring there’s no waiting period.
In 2025, One Project, a fashion platform, implemented automated return workflows tailored to customer profiles and product categories. They used automation to block returns on custom items while delivering a VIP experience for loyal shoppers.
"The process is fully automated, from the customer request to the refund."
– Shmulik Konforty, CTO at One Project
sbb-itb-a3e286c
Keeping Revenue with Exchanges and Store Credit
Refunds can take a big bite out of your revenue, but here's the thing - most customers don’t actually want their money back. They’d rather have the right product. With 60% of returns stemming from size or style issues, the real solution isn’t speeding up refunds; it’s making exchanges and store credit so easy and appealing that customers naturally choose them instead.
ForthRoute’s automated return processes are designed with this in mind. Their exchange and credit tools help businesses hold onto revenue that would otherwise be lost. On average, merchants using ForthRoute retain $123,000 in revenue through these features. The secret? Removing every bit of friction from the process so exchanges feel like a natural part of the shopping journey. Let’s dive into how ForthRoute encourages customers to choose exchanges over refunds.
Guiding Customers Toward Exchanges
ForthRoute’s self-service portal plays a key role in steering customers toward exchanges. Say a customer selects "too small" as the reason for their return - the system instantly suggests the next size up. If they’re sending back a blue shirt, it offers the same style in different colors. These smart recommendations can turn a refund request into a simple swap.
The portal also includes a "Shop Now" feature, allowing customers to exchange their return for any item in your entire catalog. By giving them the freedom to browse all your products, you increase the chances they’ll find something they love. In fact, merchants using this feature see 31% of revenue retained on average.
Another standout tool is the "Instant Exchange" option. When presented, 40% of customers choose this route, receiving their replacement products 4.6 days faster than with traditional return-first methods.
"We like [the platform] because... it makes it easy to swap out returns for other products in our shop, which helps keep the customer and the money."
– Lanai Moliterno, Founder of Sozy
With Instant Exchanges, ForthRoute even ships the replacement item before the original is returned. This builds trust and avoids the frustration of discovering the new item is out of stock. To keep the process secure, the system collects payment information upfront.
Providing Instant Store Credit
Another powerful way to retain revenue is through instant store credit. Refund delays can lead to lost sales, but instant credit solves this by giving customers access to funds as soon as their return is approved - often right when the carrier scans the package. This keeps shoppers engaged with your brand and ready to make another purchase.
To sweeten the deal, ForthRoute lets you offer "Bonus Credit." For example, if a customer returns a $50 item, you could offer them $55 in store credit instead of a straight refund. A 10% bonus, based on your average order value, often pays for itself through higher lifetime value and larger cart sizes. Plus, if the requested exchange item is out of stock, ForthRoute can automatically convert the request into store credit.
Some brands have even taken it a step further by charging a small fee for refunds, subtly encouraging customers to opt for exchanges or store credit instead. It’s a tactic now used by 33% of brands.
Using ForthRoute Analytics to Improve Returns
Manual vs Automated Returns Processing Comparison
Returns data plays a crucial role in retaining revenue and cutting down waste. ForthRoute's analytics dashboard dives deep into your returns, pinpointing which products see the most returns, uncovering why customers send items back, and identifying bottlenecks in your workflow. With the average e-commerce return rate reaching 16.9% in 2024, and each return costing between 20% and 65% of the item's original value, understanding these issues is essential to staying profitable.
Now, let’s break down how these metrics can guide actionable improvements.
Tracking Return Costs and Patterns
ForthRoute keeps tabs on critical metrics like return rates by SKU, common reasons for returns, and the total cost per return - factoring in shipping, labor, and lost resale value. If your return rate exceeds 15%-20%, it’s a clear sign that your product page may need adjustments.
The platform also identifies patterns like "bracketing", where shoppers order multiple sizes or colors with the intention of returning most of them. This behavior is especially common among Gen Z shoppers, with about 50% engaging in it when buying clothes or shoes. With ForthRoute, you can segment customers into groups - such as loyal, low-return shoppers versus high-risk, frequent returners - and tweak your policies accordingly. For example, you might exclude serial returners from free shipping offers.
Adjusting Policies Based on Data
Understanding the reasons behind returns allows you to implement targeted solutions. For instance, if "fit too small" is a recurring issue, you could add a sizing note encouraging customers to size up. For low-value items that cost more to process than their worth, consider offering a returnless refund for items priced between $15 and $40. These changes can reduce return rates while maintaining a positive customer experience.
ForthRoute also helps speed up resale processes. Electronics, for instance, lose 4% to 8% of their value each month they remain unprocessed. By monitoring processing times and flagging warehouse delays, the platform ensures items are back on your virtual shelf quickly. If inspections take longer than 48 hours, ForthRoute alerts you to potential issues. Getting returned items back into inventory within 24 hours helps you recover the maximum value.
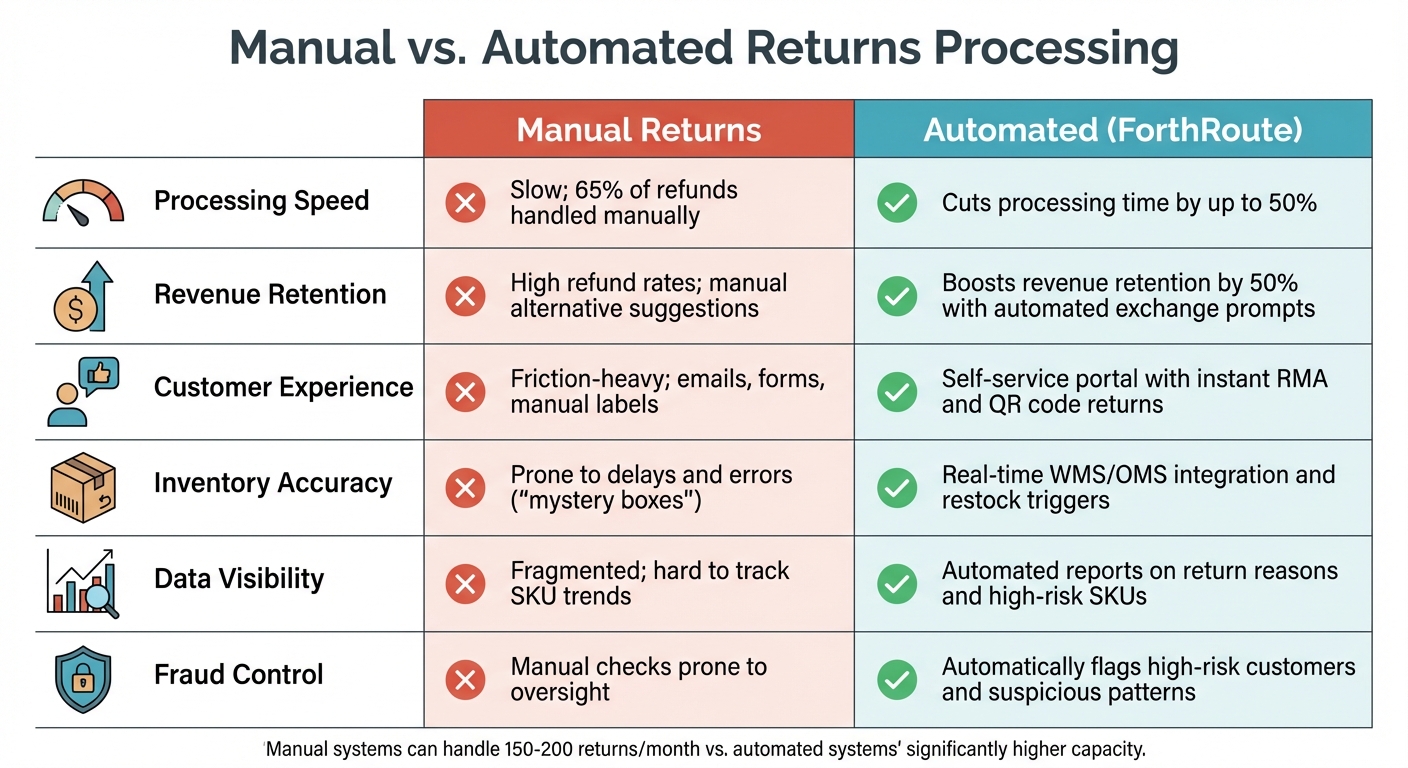
Manual vs. Automated Returns: A Comparison
The insights from ForthRoute underscore the stark differences between manual return processes and automated systems. While manual methods can handle around 150 to 200 returns per month, automation can cut processing times by up to 50%. Here's a side-by-side look:
| Feature | Manual Returns | Automated (ForthRoute) |
|---|---|---|
| Processing Speed | Slow; 65% of refunds handled manually | Cuts processing time by up to 50% |
| Revenue Retention | High refund rates; manual alternative suggestions | Boosts revenue retention by 50% with automated exchange prompts |
| Customer Experience | Friction-heavy; emails, forms, manual labels | Self-service portal with instant RMA and QR code returns |
| Inventory Accuracy | Prone to delays and errors ("mystery boxes") | Real-time WMS/OMS integration and restock triggers |
| Data Visibility | Fragmented; hard to track SKU trends | Automated reports on return reasons and high-risk SKUs |
| Fraud Control | Manual checks prone to oversight | Automatically flags high-risk customers and suspicious patterns |
Conclusion: Reducing Returns with ForthRoute
Managing high return rates doesn't have to drain your profits or overwhelm your support team. The strategies outlined here - ranging from better product descriptions to analyzing return trends - work most effectively when paired with automation and data insights. That’s where ForthRoute steps in, offering a platform that transforms returns from a financial burden into a chance to retain revenue and boost customer loyalty.
ForthRoute simplifies the returns process with features like automated approval rules and a self-service portal, cutting down on time-consuming manual tasks. Its exchange-first approach encourages customers to swap sizes or colors instantly, rather than waiting for refunds, keeping revenue in your pocket while improving the shopping experience. This not only enhances customer satisfaction but also increases the likelihood of repeat purchases. On top of that, the platform’s powerful analytics help identify areas for improvement, ensuring your operations get smarter over time.
"By using tools that automate the post-purchase process, [merchants] can reduce operational headaches. ...combining them in one powerful tool makes it easier to gather data, manage their return policy, and keep everything seamless and on-brand." - Sanaz Hajizadeh, Director of Product Management, Happy Returns
ForthRoute’s analytics dashboard is a game-changer for making informed decisions. Whether it’s tweaking a size chart, adding clearer product photos, or offering returnless refunds for low-cost items, understanding which SKUs are driving returns - and why - helps you tackle the root issues. Beyond tracking return patterns, the dashboard uncovers opportunities to further reduce returns. Considering that 96% of customers are more likely to shop again after a smooth returns experience, getting this process right directly impacts your revenue.
With features like QR code returns, instant store credit, and real-time tracking, ForthRoute delivers the seamless experience today’s shoppers expect. For just $19/month plus carrier rates, it provides enterprise-level returns management without the hassle of manual processes - bringing together all the streamlined solutions discussed in this article.
FAQs
What’s the best way to track and analyze return data to lower return rates?
To effectively monitor and analyze return data, start by logging all return-related events in your ecommerce platform. This includes refunds, return requests, and any other relevant actions. Leverage analytics tools to track key metrics such as overall return rate (calculated as returns ÷ total orders), reason codes, and product-level return percentages. These metrics can uncover trends - like specific products with higher return rates - and help you assess the impact of any changes you implement.
Take this a step further by tagging returns with details like size, color, price range, and sales channel. Breaking the data down in this way can highlight patterns. For instance, you might find that larger sizes or discounted items tend to be returned more often. Pair this information with customer feedback - such as reason codes or comments - to identify avoidable issues, like unclear product descriptions or misleading sizing charts.
Once you’ve gathered insights, take action. Set alerts for products with high return rates (e.g., exceeding 15%) and address potential problems. This could involve updating product descriptions, improving images, or refining sizing guides. Regularly reviewing your return data and making targeted adjustments creates a continuous improvement cycle, helping you lower returns while keeping customers happy.
What are the advantages of using automated return systems like ForthRoute?
Automated return systems, like ForthRoute, streamline the entire returns process, making it faster and more efficient. These systems can take care of tasks such as creating prepaid return labels, automatically approving or rejecting return requests, and processing refunds or issuing store credit - all without the need for constant manual input. This not only cuts down on labor but also reduces errors, ultimately boosting operational efficiency.
By automating steps like verifying returns, updating inventory, and triggering inspections, businesses can redirect their energy toward more strategic tasks rather than getting bogged down by repetitive ones. Plus, automation delivers useful insights, such as identifying products with high return rates. Armed with this data, businesses can refine product descriptions or adjust policies to reduce future returns.
On top of that, a quicker and smoother return experience keeps customers happier and more loyal. It even helps cut down the average cost of returns, which can often exceed $20 per item. In the end, automation benefits everyone - businesses save time and money, and customers enjoy a hassle-free process.
How do better product descriptions and visuals help reduce return rates?
Clear and thorough product descriptions are essential for helping shoppers understand exactly what they’re buying. By using straightforward, easy-to-read language and including accurate details - like dimensions, materials, and key features - you can give customers the confidence to make decisions without hesitation. This reduces the likelihood of unpleasant surprises that often lead to returns.
Equally important are high-quality visuals. Sharp images, 360° views, and videos showcasing the product from multiple angles can make a big difference. Highlighting textures, colors, and the product’s scale, as well as demonstrating its use, helps set clear expectations. When customers have a solid idea of what they’re getting, they’re far less likely to feel let down, which ultimately means fewer returns for your business.