Returns are a hidden goldmine for improving your business. They’re not just a cost but a source of insights that can enhance your products, processes, and customer experience. Here’s what you need to know:
- Ecommerce Return Rates: In 2024, returns affected 25%-30% of online sales, costing retailers $890 billion.
- Why It Matters: Analyzing return data helps cut costs, improve product quality, and boost customer satisfaction. For example, better sizing guides reduced return rates by 10% for one retailer.
- Key Metrics to Track: Return rate, refund rate, exchange rate, time-to-return, and return cost are essential for identifying issues and improving processes.
- Tools for Shopify Merchants: Platforms like ForthRoute simplify return tracking, automate approvals, and provide actionable insights.
Key Metrics for Return Analytics
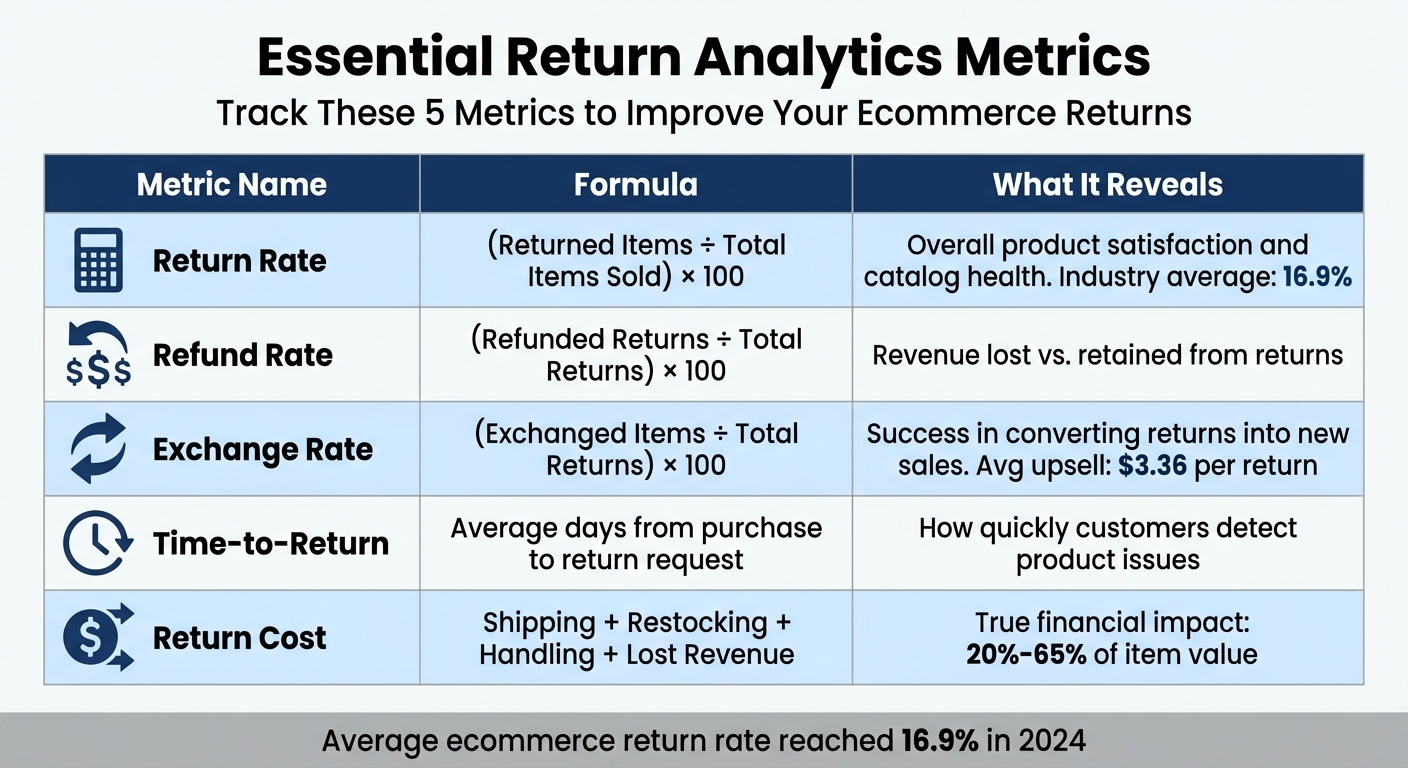
Essential Return Analytics Metrics: Formulas and Insights for Ecommerce
Tracking the right metrics in return analytics is essential for improving your product offerings and overall customer experience. These metrics turn return data into actionable insights that can protect profits and enhance operations. Without them, it’s nearly impossible to identify problem areas - whether it's specific products or customer behaviors - that need attention.
Return Rate and How to Calculate It
The return rate is the cornerstone of return analytics. You can calculate it in two ways: by units [(Returned Items / Total Items Sold) x 100] or by dollar value [(Total Value of Returns / Total Sales Value) x 100]. Recent figures show that the average ecommerce return rate reached 16.9% in 2024. Certain categories, like swimwear, see even higher rates - up to 21.6%.
To get the most value from this metric, break it down by individual SKUs and product variants. For example, if your overall return rate is 15%, but size XXL shirts are being returned at 35%, this highlights a specific issue to address. Using a return-to-order differential can also help identify products that generate disproportionately high returns relative to their sales.
It’s also critical to compare your return rates to industry standards and your own historical data. A 20% return rate might be acceptable in apparel but could signal a problem in electronics. Seasonal trends are another key factor - return rates can spike to as high as 30% during the holiday season.
Other Important Return Metrics
Beyond the return rate, several other metrics can help pinpoint where you’re losing money and where there’s room for improvement. For instance:
- Refund Rate: Measures the percentage of returns that result in refunds [(Refunded Returns / Total Returns) x 100]. This helps you understand how much revenue is being lost outright.
- Exchange Rate: Tracks how many returns are converted into exchanges [(Exchanged Items / Total Returns) x 100]. Jewelry retailers, for example, often use exchange-focused strategies, leading to an average upsell value of $3.36 per return.
- Time-to-Return: Calculates the average number of days between purchase and return request. Quick returns often point to issues like poor product quality or misleading descriptions.
- Return Cost: Represents the full financial impact of a return, including shipping, labor, handling fees, and lost revenue. A single return can cost anywhere from 20% to 65% of the item’s original value, with home goods sometimes incurring handling fees up to 17%.
- Repeat Return Rate: Highlights customers who frequently return items. For example, nearly 50% of Gen Z shoppers engage in "bracketing" - buying multiple sizes with the intent to return most of them. This metric helps differentiate between intentional behavior and genuine product issues.
| Metric | Formula | Insights Provided |
|---|---|---|
| Return Rate | (Returned Items / Total Items Sold) x 100 | Gauges overall product satisfaction and catalog health |
| Refund Rate | (Refunded Returns / Total Returns) x 100 | Quantifies revenue lost versus retained |
| Exchange Rate | (Exchanged Items / Total Returns) x 100 | Measures success in converting returns into new sales |
| Return Cost | Shipping + Restocking + Handling + Lost Revenue | Reveals the true financial impact of returns |
| Time-to-Return | Average days from purchase to return request | Identifies how quickly customers detect issues |
These metrics provide a foundation for identifying problem areas and targeting specific improvements.
Using Metrics to Find Problems
Metrics are only useful if you act on them. For example, if a SKU has a high return rate due to sizing issues, updating your sizing chart could make a big difference. Similarly, if 31% of returns are due to items "not matching the description", consider improving your product images and descriptions.
Take Gunner Kennels as an example. In 2025, they introduced 3D models and augmented reality on their Shopify store, allowing customers to virtually place crates next to their dogs to confirm sizing before purchase. This simple innovation reduced returns by 5% and boosted conversions by 40%.
Lastly, segment your data by customer type, region, and season. New customers often return more items as they adjust to your brand’s sizing or material standards. Regional data might reveal issues like shipping damage or differences in sizing preferences. Seasonal trends, such as holiday returns, can help you better manage inventory and staffing during peak times. These insights can lead to more efficient operations and a smoother customer experience.
Setting Up Return Analytics with ForthRoute
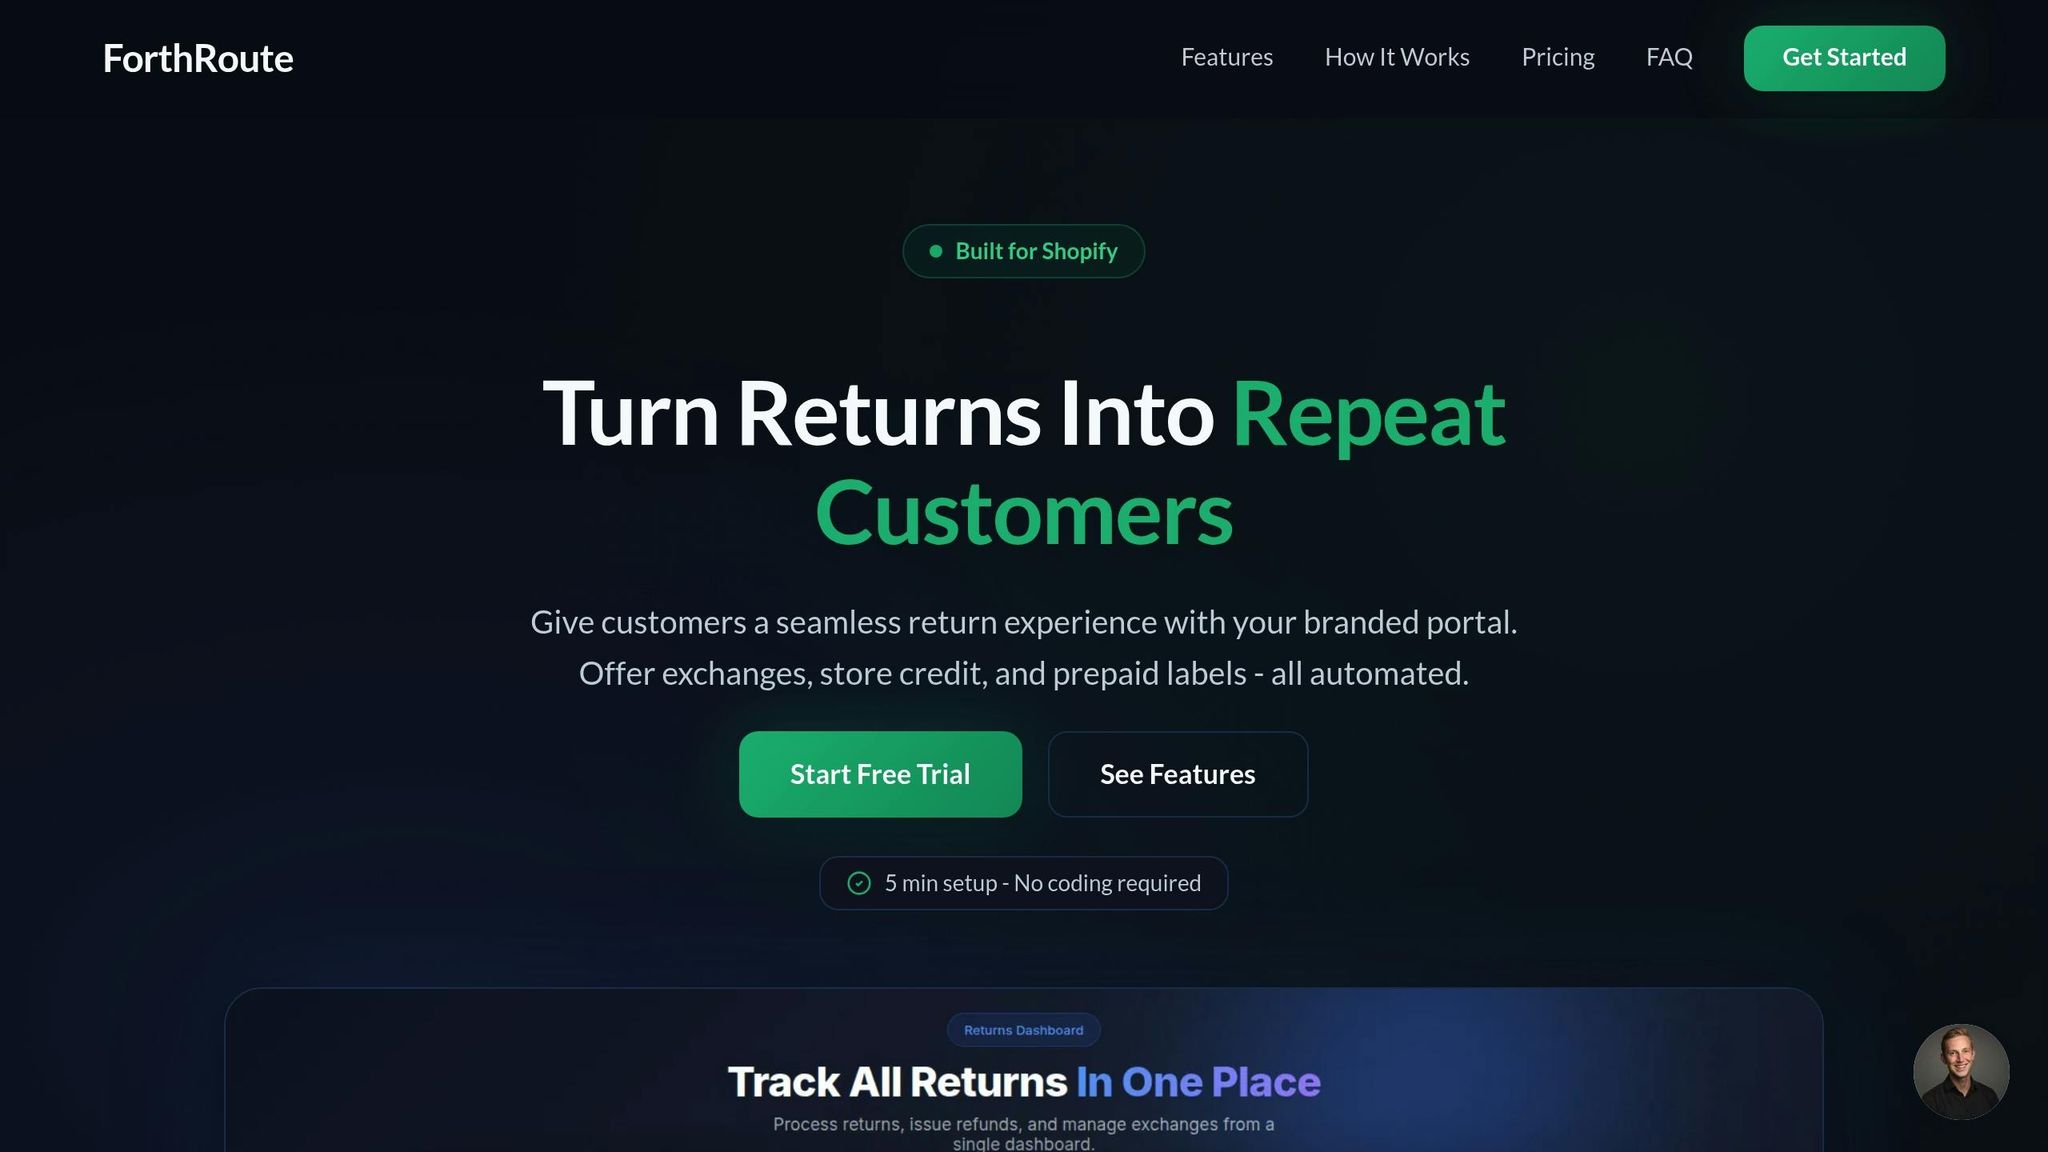
ForthRoute is designed to get up and running in just minutes. The platform seamlessly connects to Shopify, automatically starting to collect return data without the need for complex integrations or technical know-how. Once set up, it organizes all your data into easy-to-read visual dashboards that update daily, providing insights as current as the previous day. This smooth integration links your Shopify store to a proactive return management system.
Installing ForthRoute on Your Shopify Store

To begin, you’ll need to add a "Start a Return" link to your store. When customers click it, they can enter their Order ID and email to see eligible items, select the ones they want to return, choose a reason (like "too small" or "damaged"), and decide between a refund, exchange, or store credit. Predefined rules in the system then trigger automatic label generation.
During setup, you’ll configure your return policies, methods, and reasons. This helps you monitor which policies are most frequently used and quickly spot unusual patterns. For example, you can implement smart rules like "Auto-approve returns under $50" or "Reject items marked Final Sale" to streamline the process. These rules reduce the need for manual intervention, easing the workload for your support team while ensuring a smooth experience for customers. Once installation is complete, ForthRoute starts collecting return data immediately.
Collecting and Organizing Return Data
Capturing return data efficiently is essential for gaining meaningful insights. ForthRoute automatically logs every detail, including return reasons (e.g., "not as described" or "damaged"), product information (SKU, size, color), resolution type (refund, exchange, store credit), and timing data. It also tracks financial metrics like returned Gross Merchandise Value (GMV), shipping fees, restocking costs, and potential resale value losses.
This information is displayed in a visual dashboard under Analytics > Returns. Here, you’ll find charts summarizing performance over your chosen date range. The platform organizes data by product category, geographic region, and customer segments, helping you identify problem areas such as "unprofitable" SKUs, frequent returners, and seasonal trends. For instance, in 2023, Silk & Salt used these analytics to uncover a product with a 90% return rate. They found that the "small" size was incorrectly manufactured. By fixing the sizing issue and conducting monthly data reviews, they successfully lowered their overall return rate.
Automating Exchanges and Approvals
ForthRoute leverages AI to suggest alternatives - like recommending a larger size for items returned as "too small" - to encourage exchanges instead of refunds. Approval automation is based on rules you define, ensuring returns comply with your policies. When a return meets the criteria, the system approves it instantly and generates a shipping label. You can also offer "Instant Store Credit", allowing customers to shop for replacements right away without waiting for their refund to process. Plus, it supports printerless QR code returns through EasyPost integration, making the process even smoother for customers.
Analyzing Return Patterns and Trends
With ForthRoute collecting data, you can quickly dive into patterns to understand why customers return items. Your dashboard updates daily, offering near real-time insights into which products, customer groups, and regions are driving returns. Armed with this data, you can refine your product pages, make smarter inventory decisions, and improve the overall customer experience.
Finding Products with High Return Rates
To pinpoint problem products, calculate the Item Return Rate for each SKU by dividing the number of returned items by the total units sold. Take it a step further by examining individual variants - like size, color, or material - to identify specific issues. For instance, if the "Medium Blue T-Shirt" has a 40% return rate compared to just 5% for the "Medium Red T-Shirt", the issue might be related to color accuracy in your product photos or the fabric quality.
Pay close attention to the reasons customers provide for returns. If "defective" is a recurring reason for a particular SKU, it’s time to inspect your warehouse stock and contact your manufacturer. One merchant, for example, cut their overall return rate by 10% simply by improving sizing guidance based on return data. Also, check whether customers are exchanging high-return items or requesting refunds. A high exchange rate for different sizes might point to fit issues, while frequent refunds could indicate quality problems or misleading product descriptions.
Understanding these product-specific challenges is just the beginning. To fine-tune your return strategy, you'll also need to look at customer behavior.
Grouping Customers by Return Behavior
Segmenting customers based on their return-to-order ratios can reveal high-risk behaviors like bracketing or wardrobing. New customers often return items more frequently than repeat buyers because they’re less familiar with your sizing and materials. For these shoppers, offering detailed product descriptions and enhanced sizing guides can help set better expectations.
For customers with disproportionately high return rates, consider adding some friction - like removing free return perks or requiring manual approvals. On the flip side, reward loyal customers with low return rates by offering perks like instant exchanges or VIP-level return options. These strategies can help balance your return policies while building trust with your best customers.
Spotting Geographic and Seasonal Patterns
Analyzing returns by region and season can uncover patterns you might not expect. For example, if a specific shipping route has a high rate of "damaged in transit" returns, it might be time to switch carriers. Geographic data can also highlight regional preferences. If customers in the Southwest frequently return winter coats while Northeast shoppers keep them, you can adjust your inventory distribution accordingly.
Seasonal trends also play a role. Return rates tend to spike in March and October during product launches and periods of high customer acquisition, then drop in August and January when clearance sales limit returns. Use these trends to forecast sales volumes and maintain profitability during high-return periods. During clearance events, consider shortening return windows to protect your margins. Over time, tracking these cycles allows you to optimize inventory levels, ensuring that products with high return rates are ready for reverse logistics when needed.
sbb-itb-a3e286c
Strategies to Reduce Returns
Reducing returns isn’t just about cutting costs - it’s about aligning customer expectations with the reality of your products. Most returns happen due to preventable issues like unclear product descriptions, sizing mishaps, or misleading images. Addressing these problems head-on improves customer satisfaction and helps you keep more revenue. Here’s how you can tackle these challenges effectively.
Improving Product Pages and Descriptions
Your product pages are the first line of defense against unnecessary returns. If customers frequently cite "wrong size" or "poor fit" as reasons for returns, consider adding detailed size charts or model references (e.g., "Model is 5'10" wearing a medium"). This extra context helps shoppers make more informed decisions.
For complaints about colors or materials, use high-quality images taken in natural light and include close-ups of textures. As Agatha Aviso, Senior Staff Writer at TechnologyAdvice, explains:
"If you see 'not what I expected' as a top return reason, your images - not your product - are the problem".
Adding a "What's included" section can also reduce confusion about missing parts or features. Regularly audit your product descriptions to ensure they reflect the actual product. For example, one retailer in 2024 reduced returns by 10% for items commonly returned as "too small" or "too large" simply by providing clearer sizing details on their product pages.
Adjusting Your Return Policy
Your return policy should work smarter, not harder. Use your return data to fine-tune policies based on product value and customer behavior. For items with low resale value, consider adding restocking fees or shortening return windows. For low-cost products (typically under $15 to $40), offering returnless refunds - where customers keep the item but still receive a refund or store credit - can save on shipping and processing costs.
Data can also help you spot patterns like bracketing (buying multiple sizes to try on). For customers with high return rates, you might introduce manual approval steps. On the flip side, loyal customers could benefit from perks like auto-approvals or extended return windows. Interestingly, longer return windows may reduce returns overall, thanks to the "endowment effect" - the longer customers hold onto an item, the more likely they are to keep it.
Using ForthRoute to Keep Customers
ForthRoute simplifies the return process while helping you retain sales. This tool automates workflows to prioritize exchanges and store credit. For example, if a customer initiates a return due to sizing, the system can suggest an exchange for a different size and even offer a small incentive (like a $5–$10 bonus) for choosing store credit over a refund.
For high-value or frequently returned products, you can implement smart approval rules to flag certain orders for manual review while auto-approving low-risk returns. This reduces the workload for your support team and protects your bottom line. ForthRoute’s real-time analytics dashboard also lets you track what’s working and adjust your strategies as needed. By converting potential refunds into exchanges or store credits, you’re not just lowering return rates - you’re building stronger customer relationships that last.
Conclusion: Using Return Analytics for Growth
Return analytics takes raw data and turns it into actionable strategies that safeguard your profits. By digging into why customers return products, identifying problematic items, and shifting refunds toward exchanges, you're not just managing returns - you’re building a more efficient and profitable business.
"By collecting data analytics around product returns, you can use this business intelligence to help you improve the customer experience, optimize your supply chain, and even improve your product selection".
These insights don’t just highlight current challenges - they also point the way to meaningful improvements.
Key Takeaways
Top-performing Shopify merchants track returns at the SKU level to uncover issues like sizing, quality, or misleading descriptions before they escalate. Metrics such as the return-to-order differential help identify items that see unusually high return rates, even if their sales volumes are strong. Monitoring the percentage of returns that convert into exchanges instead of refunds is another critical metric - especially since 31% of retailers report that returns significantly impact their profit margins. Every small improvement in this area directly boosts profitability.
Operational efficiency also plays a big role. Automating return approvals and flagging high-risk cases for manual review saves time and reduces errors. Customer segmentation helps distinguish between loyal shoppers and serial returners, enabling tailored policies to curb fraud. And by auditing shipping carriers or analyzing open-ended feedback for recurring issues like "scratchy fabric", you’re addressing the root causes of returns rather than just the symptoms.
The goal? Apply these insights to streamline your processes and protect your bottom line.
Next Steps for Shopify Merchants
Adding ForthRoute to your Shopify store can kickstart your return analytics journey. With this tool, you can collect daily return data and leverage the metrics discussed above to identify problem areas and drive strategic improvements. The analytics dashboard provides a clear view of which products have the highest return rates, the most common reasons for returns, and how much revenue you’re retaining through exchanges or store credit. Use this information to refine product descriptions, tweak return policies, and automate repetitive tasks.
In 2023, the U.S. returns market hit $248 billion, with refund-to-exchange conversions boosting retention rates by up to 40%. These numbers highlight just how impactful a well-managed return process can be. With ForthRoute’s daily updates, you can respond quickly to spikes in returns and turn what was once a cost center into a growth opportunity. Start tracking your returns today and transform them into a competitive advantage.
FAQs
How can analyzing returns benefit my ecommerce business?
Return analytics provides valuable insights into your ecommerce operations. It helps pinpoint common reasons for returns, identify products with higher return rates, and understand customer behavior patterns. Using this data, you can work toward lowering return rates, minimizing shipping and fraud expenses, and strengthening customer loyalty.
Beyond that, return analytics supports smarter decisions regarding product quality, inventory management, and supply chain strategies. These improvements can streamline operations, increase revenue, and deliver a smoother, more satisfying shopping experience for your customers.
What key metrics should ecommerce businesses track to analyze returns effectively?
Tracking the right metrics is key to gaining insights and making improvements to your return processes. Here are some of the most valuable ones to keep an eye on:
- Overall return rate: This shows the percentage of total orders that customers send back.
- Return-to-refund time: Measures how long it takes to complete the return process and issue refunds.
- Repeat return rate: Tracks how often the same customers return items multiple times.
- Cost of returns: Includes all expenses tied to handling returns, such as shipping fees and restocking costs.
- Top return reasons: Highlights the most frequent reasons customers decide to return products.
- Variant-level returns: Breaks down returns by specific product variations, like size or color, to identify trends.
By keeping tabs on these metrics, ecommerce businesses can identify patterns, tackle the underlying causes of returns, and fine-tune their processes to cut costs while boosting customer satisfaction.
How does ForthRoute help Shopify businesses analyze and manage product returns?
ForthRoute offers robust tools designed to help Shopify businesses dig deeper into their return patterns and simplify the entire return management process. By examining return data, businesses can pinpoint common reasons for returns, monitor trends, and discover actionable ways to lower return rates.
Using ForthRoute, you can refine your post-purchase strategies with ecommerce-focused metrics. This means boosting operational efficiency, improving customer satisfaction, and tackling the unique challenges Shopify merchants often face. With practical solutions and insights grounded in data, ForthRoute ensures your return process remains efficient and customer-centric.