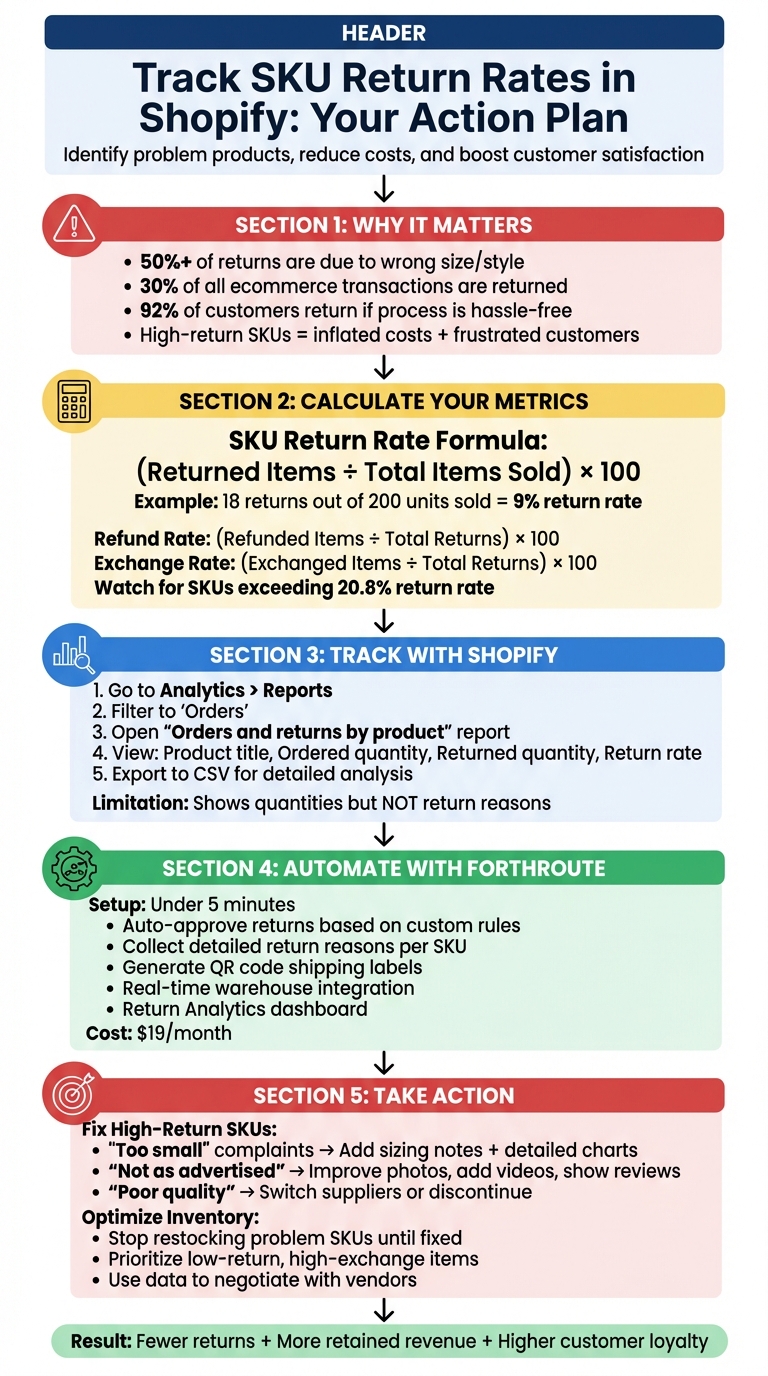
Understanding SKU-level return rates is crucial for identifying which products are causing issues in your Shopify store. While overall return rates provide a broad picture, diving deeper into SKU-specific data helps you pinpoint problematic products, reduce costs, and improve customer satisfaction. Here's the key takeaway:
- Why it matters: High-return SKUs can signal issues like unclear descriptions, sizing problems, or quality defects. These can lead to inflated costs and frustrated customers.
- How to measure it: Use the formula: (Returned Items ÷ Total Items Sold) × 100. For example, if 200 units of a product are sold and 18 are returned, the return rate is 9%.
- What tools to use: Shopify's built-in analytics can track return rates, while apps like Forthroute automate the process and provide detailed insights into return reasons.
How to Track and Reduce SKU Return Rates in Shopify: Step-by-Step Guide
SKU-Level Return Metrics Explained
What Are SKU Return Rates?
A SKU return rate represents the percentage of units returned for a specific SKU. To calculate it, use the formula: (Returned Items ÷ Total Items Sold) × 100. For instance, if 200 units of a medium-sized blue t-shirt were sold and 18 were returned, the return rate for that SKU would be 9%.
This level of detail is important because individual SKUs - like a specific shoe style in size 8 - can have return rates that differ significantly from your overall average. Tracking SKU-specific data helps identify issues like design flaws, sizing problems, or unclear product descriptions that might not be obvious when looking at store-wide metrics. Considering that over 50% of Shopify returns are due to customers ordering the wrong size or style, pinpointing troublesome SKUs is essential for reducing returns and improving customer satisfaction.
Now, let’s explore additional metrics that provide actionable insights into return trends.
Key Metrics to Track
To better understand return patterns, calculate the refund rate using (Refunded Items ÷ Total Returns) × 100 and the exchange rate using (Exchanged Items ÷ Total Returns) × 100. These metrics help distinguish between revenue lost and revenue retained. For example, a high refund rate for a specific SKU could indicate customer dissatisfaction caused by quality issues or inaccurate descriptions. On the other hand, a high exchange rate often points to preference-related issues, such as incorrect sizes or colors, rather than fundamental product flaws.
Examining return reasons can also uncover valuable insights. When customers cite reasons like "too small", "poor quality", or "damaged on arrival", you can identify whether the problem lies in marketing (e.g., misleading photos) or manufacturing (e.g., defective batches). Additionally, the secondary purchase rate - which measures how often a SKU leads to repeat orders - can highlight products that build customer loyalty even with moderate return rates. For example, a SKU with a 20% return rate but strong repeat purchases may still be a key asset, while a low-return SKU with minimal repeat business might be less impactful. By evaluating secondary purchase rates alongside return metrics, you can fine-tune your inventory and optimize product offerings.
Using Shopify's Built-In Analytics for Returns
How to Access Return Reports in Shopify
Shopify offers built-in tools to help you track return data. To get started, log into your Shopify admin panel and navigate to Analytics > Reports. From there, filter the category to Orders to access pre-built reports. One key report you'll rely on is the Orders and returns by product report, which shows how many units were ordered versus how many were returned within a specific timeframe. You can also access these reports via the Shopify mobile app.
"The Orders and returns by product report helps you understand which products are your best sellers, and which get returned the most often." - Shopify Help Center
This report includes four main columns:
- Product title: The name of each product.
- Ordered quantity: The total number of units sold.
- Returned quantity: The total number of units returned.
- Return rate: The percentage of items returned compared to those ordered.
To dig deeper into the data, you can adjust these reports to view information at the SKU level.
Filtering Reports for SKU-Level Data
By default, Shopify's reports show product titles, but if you're managing items with multiple variants (like sizes or colors), you'll want to analyze data at the SKU level. To do this, use the Sales over time report, click Edit columns, and add Returned Quantity and Return Rate. Sorting the "Orders and returns by product" report by Return rate in descending order can help you quickly spot items with the highest return rates.
You can also use the date range selector to focus on specific time periods, such as seasonal trends or the performance of recent product launches. For more advanced analysis, ShopifyQL or Sidekick can help you create custom queries when the standard dashboards don’t provide enough detail. If you need a complete breakdown of each variant's performance, exporting your product data to a CSV file is a good option.
Keep in mind that Shopify's analytics focus on quantitative data - like return rates and quantities - and don't automatically provide qualitative insights, such as why items are being returned (e.g., sizing issues or defects). Additionally, some report data may take up to 24–48 hours to process. These limitations are worth considering if you're exploring automation or third-party tools to enhance your return analysis.
Automating SKU Return Tracking with Forthroute
How Forthroute Automates Returns
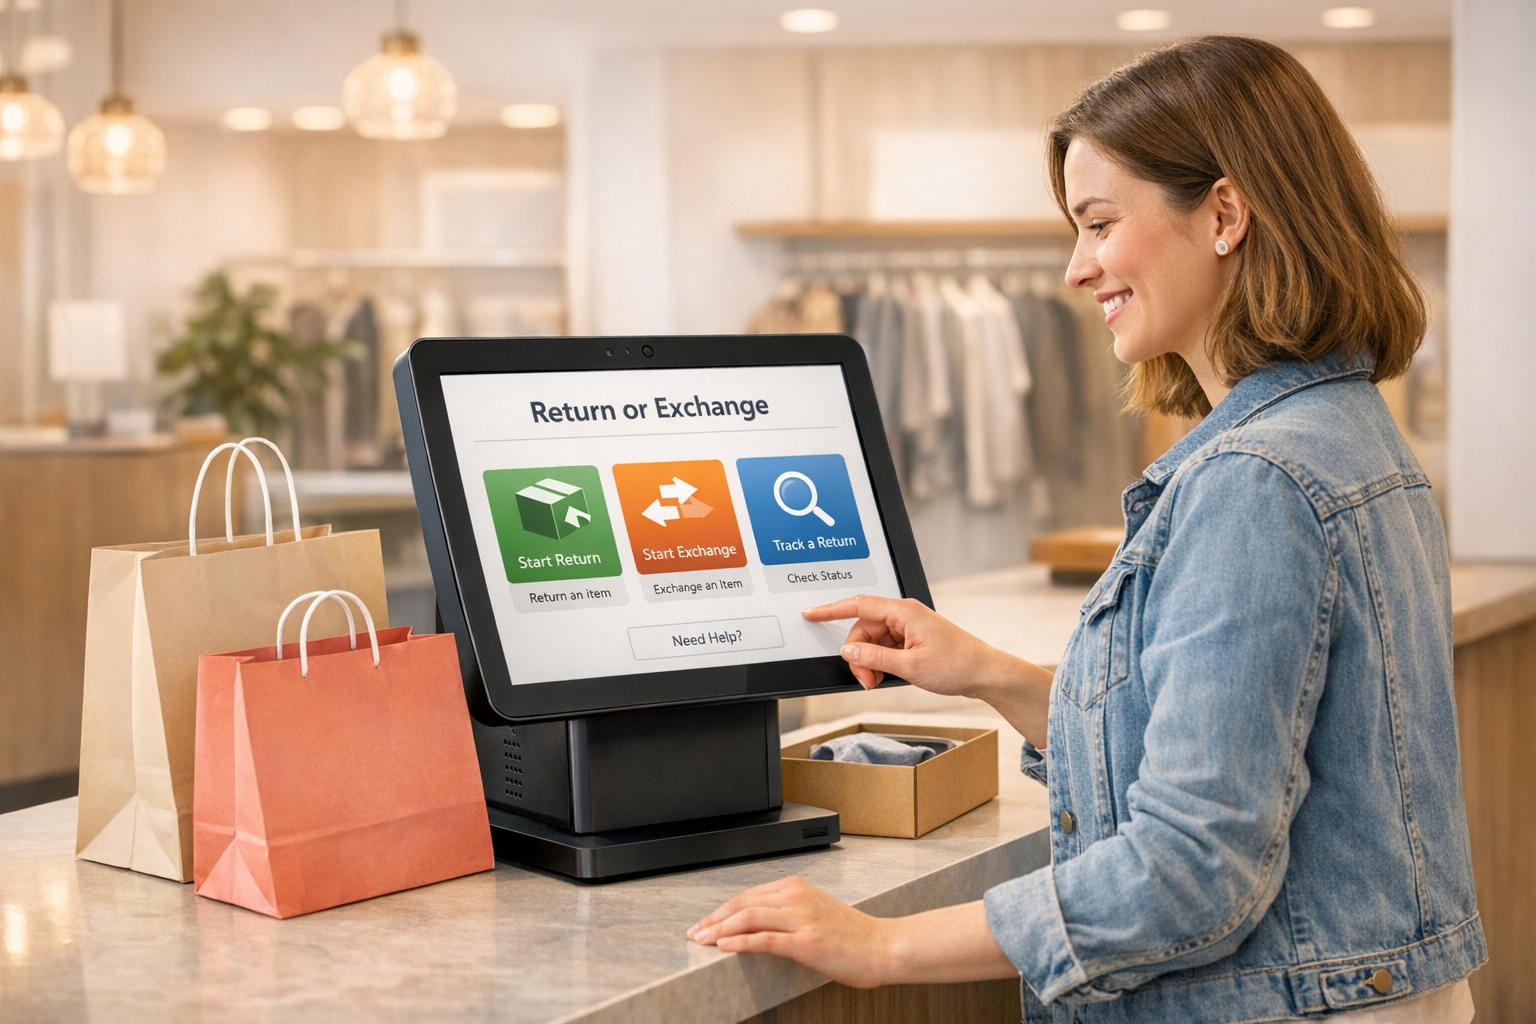
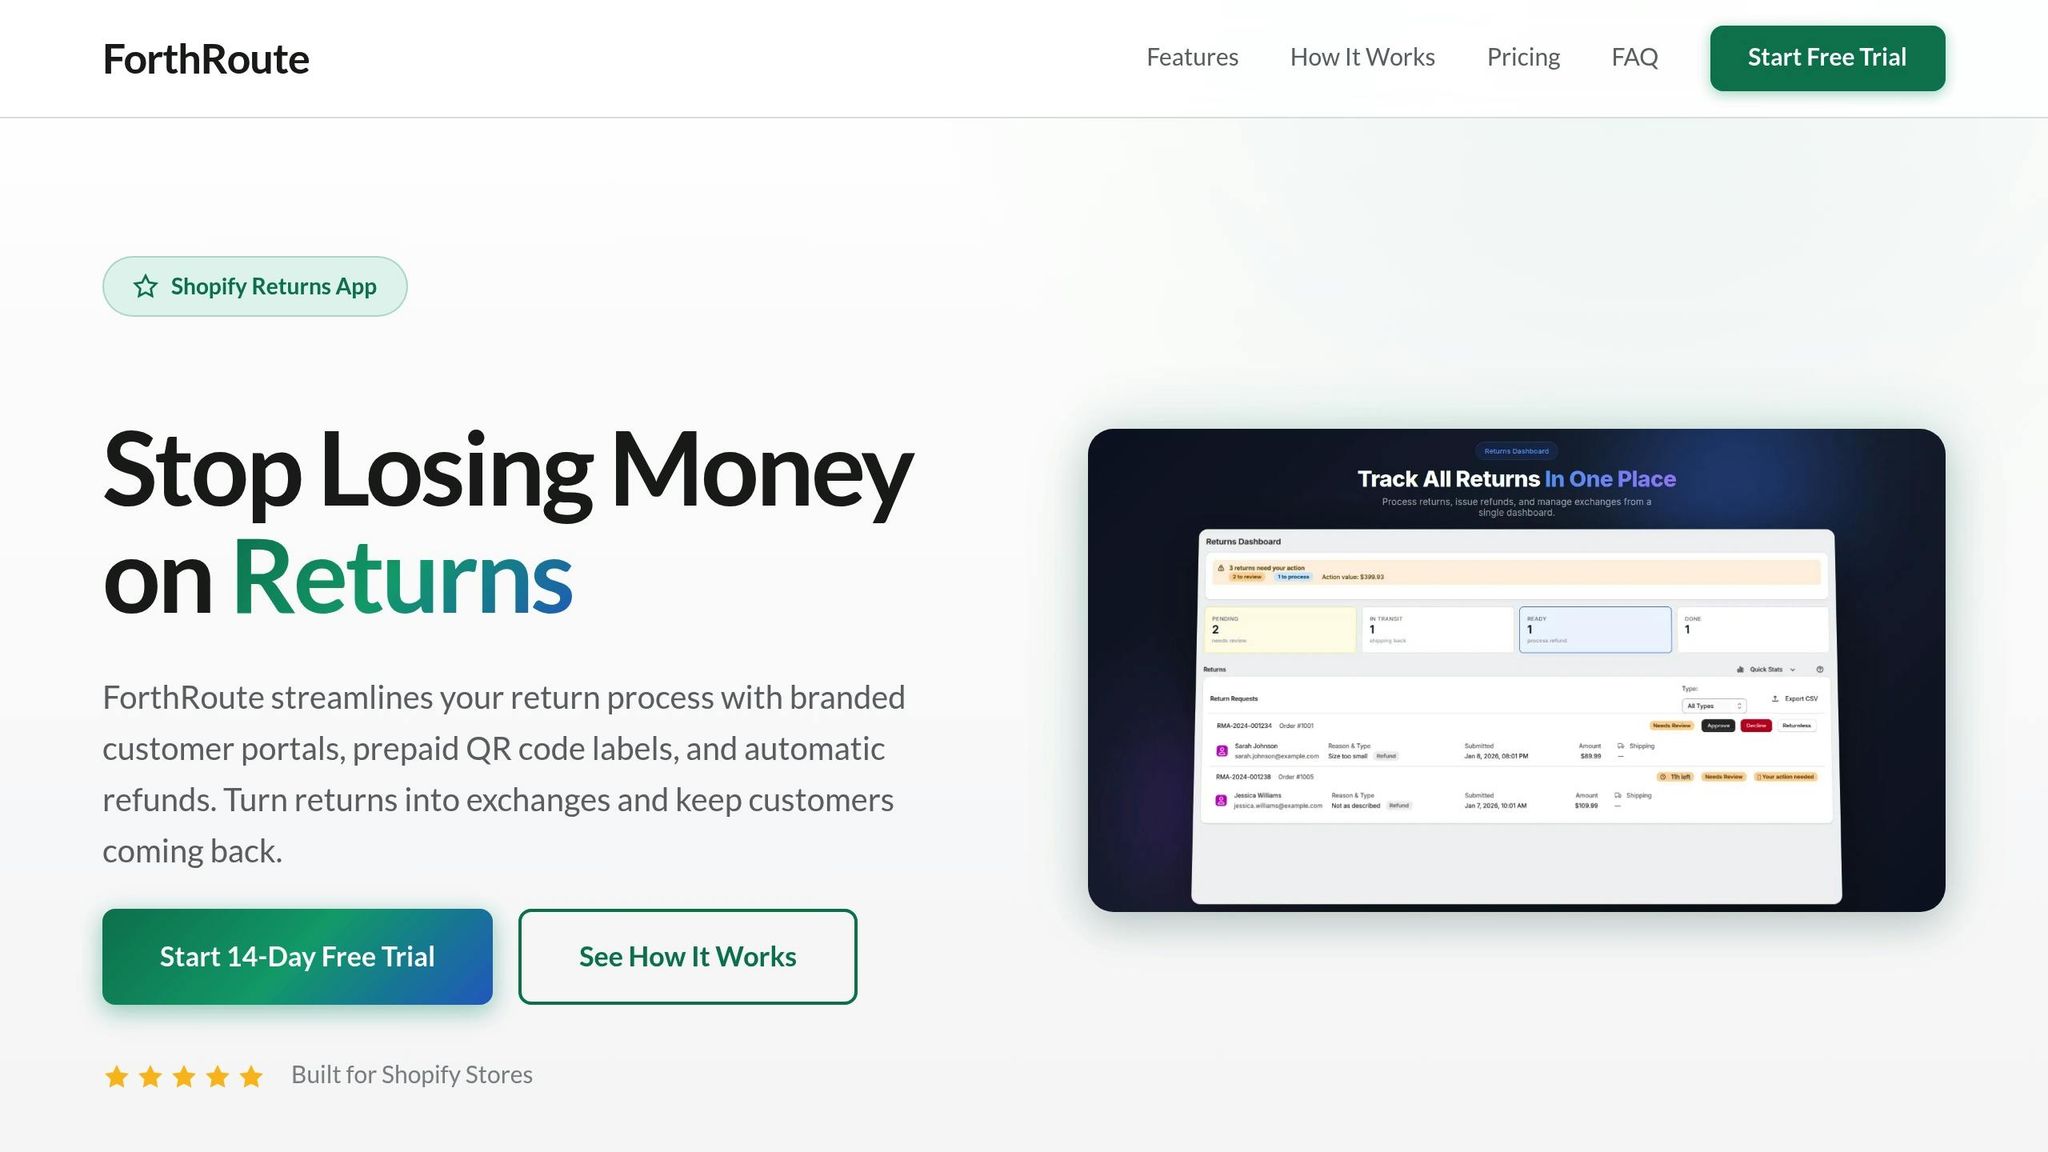
Shopify's built-in reports may cover the basics, but Forthroute takes return tracking to the next level by automating the process and focusing on SKU-level insights. Setting it up is quick - your Shopify store can connect to the app in under 5 minutes. Once integrated, Forthroute provides a branded, self-service portal where customers can easily handle returns.
Here's how it works: Customers enter their order number and email to access a list of items eligible for return. They select the specific SKU they want to return, provide a reason like "Too small" or "Wrong color", and choose their preferred resolution - refund, exchange, or store credit. If the return complies with your predefined rules, the system auto-approves the request and generates a prepaid shipping label. For added convenience, Forthroute supports QR code labels, allowing customers to drop off returns without needing to print anything.
The automation doesn't stop there. Forthroute integrates with your warehouse operations via a webhook API, seamlessly connecting with 3PL and WMS providers. This ensures real-time updates as returned SKUs are received, inspected, and restocked, keeping your inventory data accurate. This streamlined process not only saves time but also enables precise tracking of return reasons at the SKU level.
Collecting Return Reasons for Each SKU
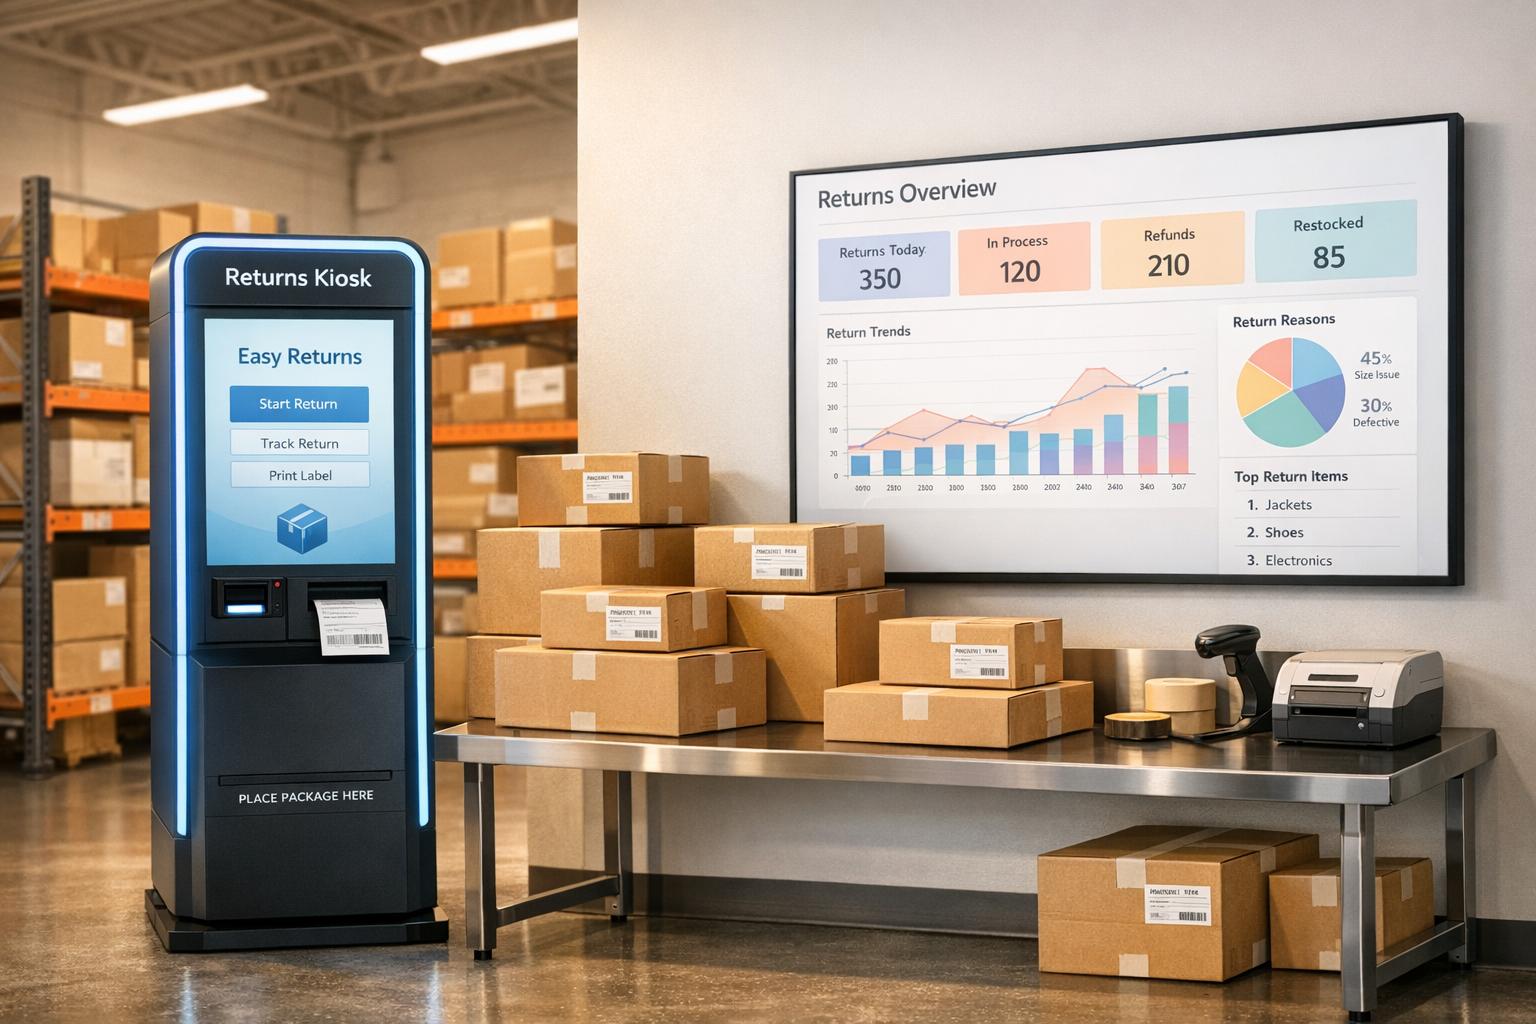
Forthroute goes beyond automating returns by gathering detailed return reasons, offering insights that can directly influence product improvements. When customers initiate a return through the portal, they're required to specify a reason. This information feeds into Forthroute's Return Analytics, highlighting trends and recurring issues that standard Shopify reports might miss.
While Shopify's reports focus on return quantities and percentages, Forthroute dives deeper. It captures qualitative data, giving you actionable insights for targeted improvements. You can also customize SKU-specific rules, such as automatically approving returns for items under $50, flagging high-value products for manual review, or rejecting "Final Sale" items outright. These features, available with Forthroute's Professional plan, make it easier to manage returns while uncovering valuable SKU-level data. Pricing details can be found on the app's page.
sbb-itb-a3e286c
Using SKU Return Data to Improve Your Business
By analyzing SKU return data, you can make smarter decisions about your products and inventory, ultimately improving your business's performance.
Finding High-Return SKUs
Start by pulling the "Orders and returns by product" report from Shopify Analytics. This report shows ordered quantities, return rates, and the number of returns for each SKU. Pay close attention to SKUs with return rates exceeding 20.8% - these are the ones causing the most trouble.
Dig deeper into specific variants to uncover patterns. For instance, if a blue medium-sized t-shirt has a 35% return rate while other sizes or colors hover around 15%, you’ve identified a problem variant. The qualitative data collected by tools like Forthroute - such as reasons like "too small", "damaged", or "not as advertised" - can help you figure out exactly why customers are sending these items back.
Lowering Return Rates Through Product Changes
Once you've identified high-return SKUs and the reasons behind the returns, take steps to address the issues. For example:
- If "too small" is a recurring complaint, add a note on the product page like: "This item runs small - consider ordering one size up." Include a detailed size chart with exact measurements (inches for height, chest, waist, and length) to help customers choose the right fit.
- For "not as advertised" returns, enhance your product pages with high-quality images taken from multiple angles, videos showing the product in action, and user-generated photos or reviews.
- If "poor quality" or "defective" keeps popping up, it’s time to reevaluate your supplier or manufacturer. Use this data in discussions with your vendors to push for better quality or consider switching to a more reliable source.
By addressing these issues, you can reduce return rates and improve customer satisfaction.
Making Better Inventory Decisions
Your return data should guide inventory decisions. Avoid restocking SKUs with consistently high return rates due to quality issues until those problems are resolved. Instead, prioritize SKUs with low return rates and high exchange rates, as they indicate satisfied customers and a good product-market fit.
Keep an eye on SKU return rates (calculated as returned items ÷ total units sold). Use the reasons captured by Forthroute to decide whether to restock or discontinue specific SKUs. If you notice that a particular vendor’s products consistently have higher return rates, use that information to make more informed purchasing decisions moving forward. By refining your product mix based on return data, you can cut costs and build stronger customer loyalty over time.
Conclusion
Keeping a close eye on SKU return rates in Shopify isn’t just about protecting your revenue - it’s about making smarter choices for your inventory. When you track returns at the SKU level, you gain the insights needed to tackle challenges like sizing issues, unclear product descriptions, or unreliable manufacturers. With approximately 30% of all ecommerce transactions being returned, digging into this data is a must if you want to maintain profitability.
Tools like Forthroute simplify this process by automating returns management while gathering the data you need. Features like automated approval rules, instant shipping labels, and detailed return reason tracking eliminate tedious manual work. This not only lightens the load for your support team but also gives you the information needed to refine your product catalog. The result? Fewer returns and more retained revenue.
One of the biggest advantages here is retaining revenue. Encouraging exchanges or store credit instead of refunds transforms potential losses into sales you keep. Plus, with 92% of customers saying they’d shop again if the returns process is hassle-free, offering a smooth experience doesn’t just save the current sale - it builds lasting customer loyalty.
For just $19/month, Forthroute offers features like QR code labels, automated workflows, and real-time analytics. These tools help you reduce return rates, boost customer satisfaction, and protect your profits - all at a price that makes sense for your business.
Start tracking SKU return rates today to pinpoint which products need adjustments or removal. By using these insights, you’ll see steady improvements in both your store’s performance and your customers’ loyalty.
FAQs
How can I lower return rates for specific SKUs in my Shopify store?
To tackle high return rates for specific products, the first step is digging into the data. Analyze return statistics to pinpoint which SKUs have elevated return rates and understand the reasons driving those returns. Tools like Forthroute can be a game-changer here, offering SKU-level analytics that reveal patterns - whether it’s sizing discrepancies, unclear product descriptions, or quality issues.
Once you’ve identified the problem areas, focus on targeted solutions. For example, refine product descriptions to make them more accurate, provide detailed sizing guides, or tighten up quality control processes. Forthroute also offers automation tools to simplify the return process, making it easier to encourage exchanges or store credit rather than outright refunds - helping to retain revenue within your business. Continuously reviewing return feedback and making small, informed adjustments can reduce future returns while boosting customer satisfaction.
How can analyzing SKU-level return data help improve product quality?
Digging into SKU-level return data can reveal a lot about what's working - and what's not - with your products. By closely analyzing why specific SKUs are being returned, merchants can uncover recurring problems like product defects, inconsistent sizing, or even confusing product descriptions. Armed with this information, businesses can make targeted changes, such as improving manufacturing processes, tightening quality control, or clarifying product details.
But the benefits don’t stop there. Return data can also shape inventory and product development strategies. For instance, high return rates might point to the need for supplier reviews or better packaging. On the flip side, SKUs with low return rates can spotlight features that should be highlighted in marketing campaigns. Over time, using SKU-specific insights helps businesses tackle issues before they grow, boost customer satisfaction, and cut down on return-related costs.
How does Forthroute simplify return tracking for Shopify merchants?
Forthroute simplifies return tracking by providing real-time insights into return rates, reasons, and processing times. This helps Shopify merchants spot patterns, tackle recurring return issues, and refine their returns process for better efficiency.
The platform also enables you to monitor returns at the SKU level, empowering you to make smarter, data-informed choices that enhance inventory management and boost customer satisfaction.